Predefined Parameters
Predefined parameters are a SPC Chart PRO way to set control limits: the center line, σ, the control limits, and the specification limits come from outside the chart instead of being estimated from the plotted data.
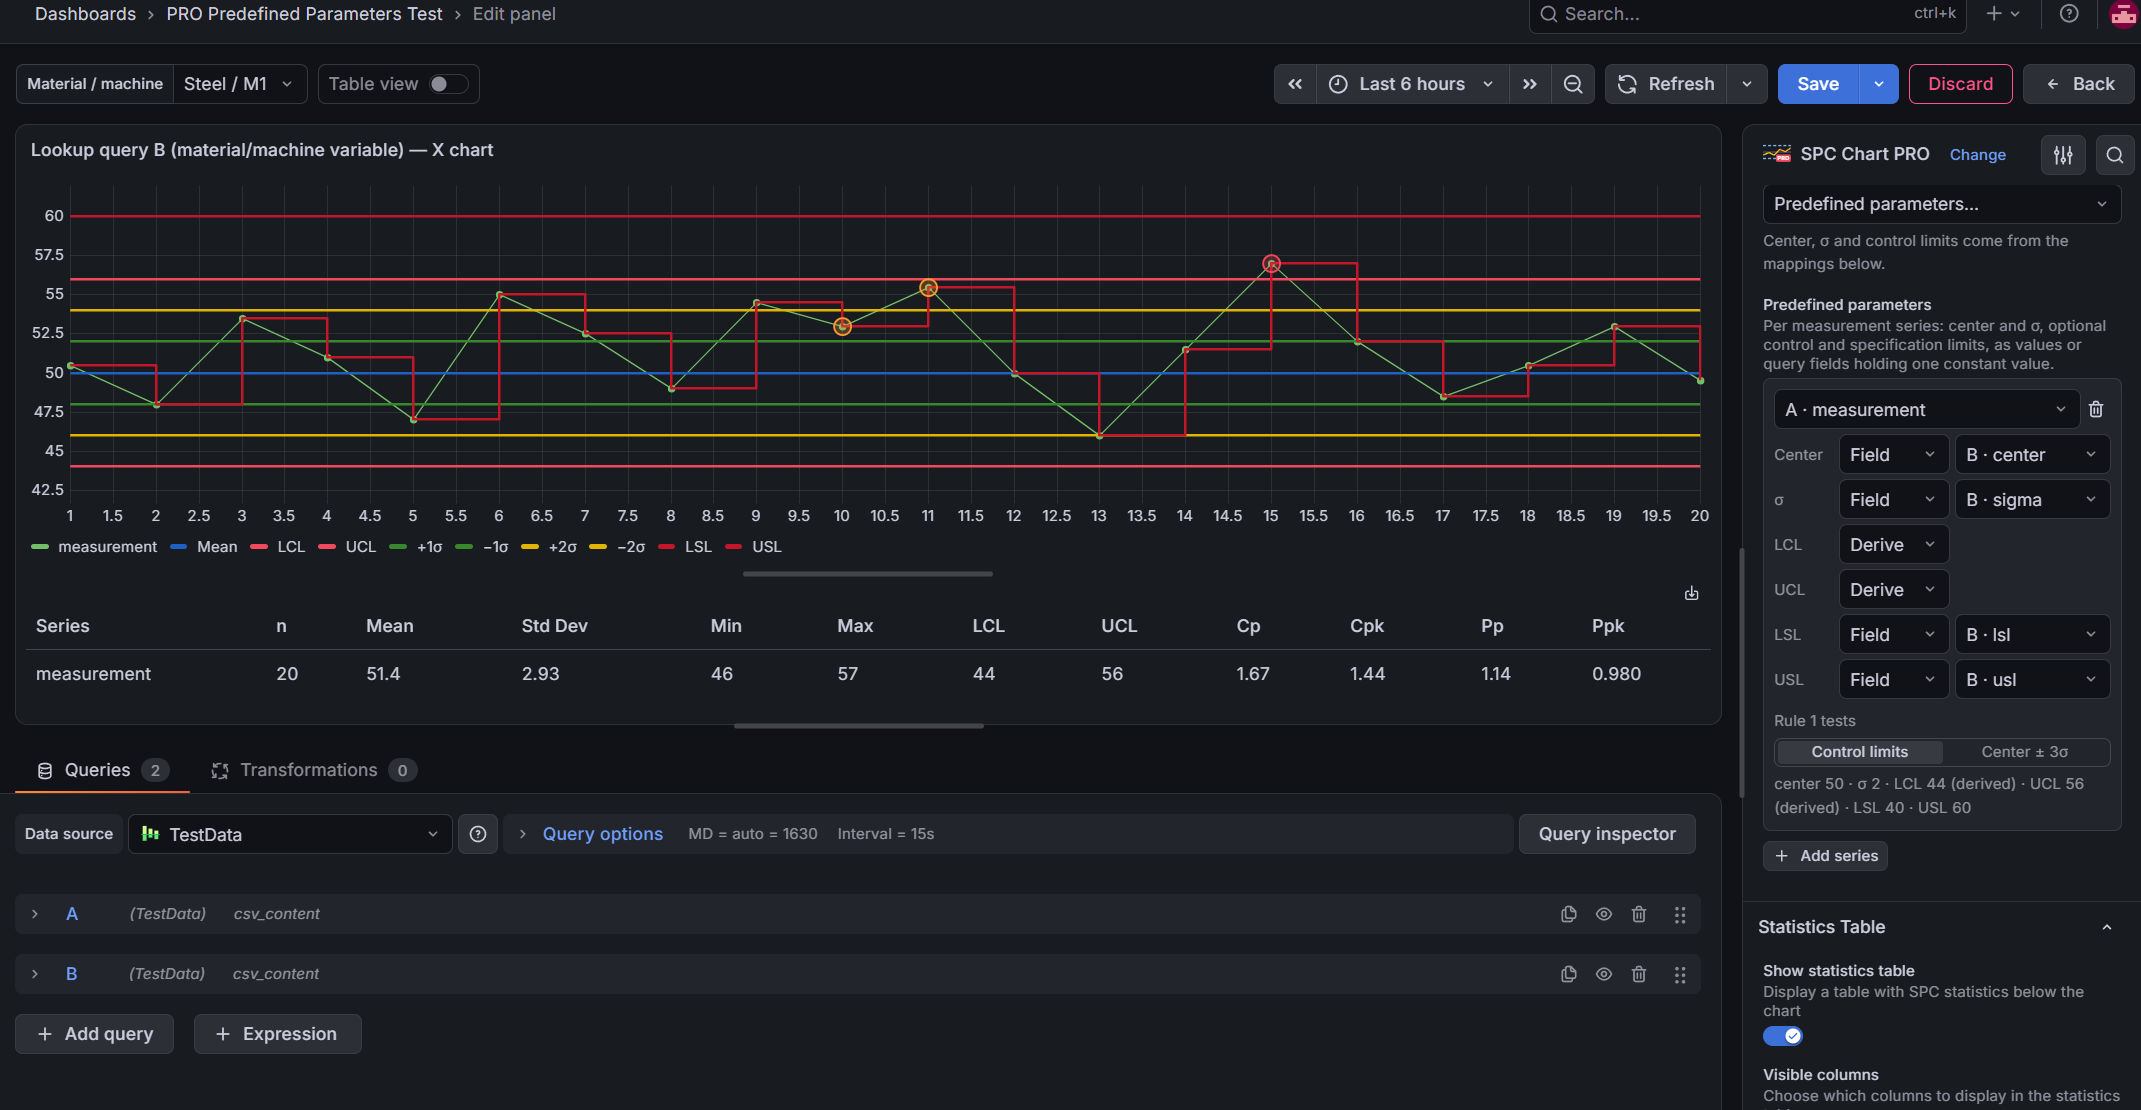
Many plants keep approved limits in a quality system, a characteristic database, or a control plan. Each material, machine, or part has its own validated set. Estimating limits again from whatever is on the dashboard would disagree with that approved set, and the estimate would move as the time range scrolls. With predefined parameters, you type the values into the panel or read them from a query, for example a lookup of the approved set for the material and machine selected in a dashboard variable. The chart then draws those exact values.
Each measurement series gets its own set of parameters. The chart lines, sigma zones, run rules, capability indices, statistics table, and CSV export all use those values.
Where It Applies
Predefined parameters are available on the chart types that plot individual values or subgroup means:
- X chart (XmR)
- X chart (Xbar-R)
- X chart (Xbar-S)
The mR, R, and S charts keep estimating their own limits, and the option is not offered for attribute, time-weighted, or short-run charts. If you switch a panel to a chart type that does not support predefined parameters, the setting stays saved with the dashboard, but the chart estimates its limits automatically. A note beneath Calculation says so.
Getting Started
- Add the queries the panel needs: the measurements, and optionally a query that returns the parameter values.
- In the Control limits section, set Calculation to Predefined parameters….
- Click Add series. The new mapping picks the first measurement series that does not have one yet.
- For each parameter, choose where its value comes from: a typed Value or a query Field.
- Check the summary line under the mapping. It shows the values in force, or explains what is missing.
The mapping editor reads the panel's current query results. If it shows Run the queries to choose series and fields, refresh the panel first.
Parameters
Every mapping covers one measurement series and six parameters:
| Parameter | Sources | Required | When omitted |
|---|---|---|---|
| Center | Value, Field | Yes | — |
| σ | Value, Field | Yes | — |
| LCL | Derive, Value, Field | No | Derive: center − 3σ of the plotted statistic |
| UCL | Derive, Value, Field | No | Derive: center + 3σ of the plotted statistic |
| LSL | None, Value, Field | No | No lower specification limit |
| USL | None, Value, Field | No | No upper specification limit |
- Value: type the number into the mapping. It is saved with the dashboard.
- Field: read the number from a numeric field returned by any of the panel's queries.
- Derive (LCL/UCL only): compute the limit from center and σ with the chart's 3σ formula.
- None (LSL/USL only): leave the specification bound out.
When you switch a parameter to Field and exactly one query field has the parameter's name (center, sigma, lcl, ucl, lsl, or usl, in any case), that field is selected for you.
Mapping Options
Below the parameters, each mapping has two more settings:
| Option | Description | Default |
|---|---|---|
| σ describes | Process σ is the σ of individual measurements; the chart divides it by √n for the subgroup means. σ of the mean is already the σ of the plotted subgroup mean. Shown only for X charts of Xbar-R and Xbar-S. | Process σ |
| Rule 1 tests | Control limits flags points outside LCL/UCL. Center ± 3σ flags points beyond 3σ, whatever the limits are. See Run Rules. | Control limits |
Supplying Parameters from a Query
A query field used as a parameter must hold one constant value. That can be a single row, or the same value repeated on every row. The panel never averages the column. It rejects a field that returns no rows, has a missing or non-numeric value in any row, or has two different values. A parameter must be a known constant, not a statistic of whatever the query returned. The editor shows the error, and the series is plotted without limits until the problem is fixed.
Two data shapes work.
A lookup query. A separate query returns one row with the approved values, for example:
| center | sigma | lcl | ucl | lsl | usl |
|---|---|---|---|---|---|
| 50 | 2 | 40 | 60 | 38 | 64 |
Filter it with dashboard variables, such as WHERE material = '$material' AND machine = '$machine', so that choosing a different material loads its parameter set. A lookup query is never plotted, even when it has a time column.
Constant columns beside the measurements. The measurement query also returns the parameters as extra columns, for example through a join, with the same value on every row:
| time | diameter | center | sigma |
|---|---|---|---|
| 08:00 | 50.4 | 50 | 2 |
| 08:05 | 49.1 | 50 | 2 |
Fields used as parameters are treated as inputs, not measurements. They are hidden from the plot, legend, tooltip, and statistics table, and they are not offered as measurement series.
In the editor, fields are listed by query and name, such as B · center. When one query returns several frames with the same field name, the frame's labels or name are added, such as A · Value {machine="M1"}, so each field can be told apart. If a saved field is missing from the current results, the editor still shows it, marked (not in results).
Several Measurement Series
Add one mapping per measurement series. The series can be several value columns of one query, or several queries or frames. Each mapping has its own center, σ, and limits, which can come from different fields of the same lookup query.
- A series with no mapping is plotted without control limits or run rules. It is never estimated from the data. The editor lists these series beneath the mappings.
- A series that is configured by two mappings has no single parameter set, so neither mapping applies until one is removed.
Subgroup Means
On X charts of Xbar-R and Xbar-S, the plotted statistic is the subgroup mean. Its σ is smaller than the σ of individual measurements by √n, where n is the Subgroup size. σ describes tells the panel which of the two you supplied:
| σ describes | σ of the plotted mean (zones, derived limits) | Process σ (Cp/Cpk) |
|---|---|---|
| Process σ | σ / √n | σ |
| σ of the mean | σ | σ · √n |
On the X chart of XmR, n = 1 and the two are the same, so the option is hidden.
The summary line under a subgrouped mapping shows both values, for example σ 2 (σ of mean 1) at a subgroup size of 4.
Predefined limits assume exactly n observations in every mean. An incomplete subgroup, such as a trailing subgroup that is still filling or a subgroup with a missing measurement, is left as a gap on the chart and in the run rules instead of being plotted against limits that do not apply to it.
Control Limits and Sigma Zones
The center line, LCL, and UCL control lines draw the predefined values. The ±1σ and ±2σ sigma zone lines are placed from the supplied σ of the plotted statistic, not from the distance between the limits. The statistics table's LCL and UCL columns show the predefined limits.
When the supplied LCL and UCL are not center ± 3σ, for example an approved limit set that is wider than 3σ, the editor shows a warning with the ±3σ range for comparison. To show both on the chart, add the +3σ and −3σ lines from the Add control line dropdown. They are drawn at center ± 3σ and differ from the LCL/UCL whenever the limits were supplied separately from σ.
Run Rules
The Nelson rules use the predefined parameters:
- Rule 1 tests what Rule 1 tests selects. With Control limits, a point outside the supplied LCL/UCL is flagged, and the violation is described as One point outside the control limits. With Center ± 3σ, the rule ignores the supplied limits and flags points beyond center ± 3σ, as described in the rule reference.
- Rules 2–8 use the center line and the supplied σ of the plotted statistic. The zone rules (5–8) do not use the drawn limits.
The two Rule 1 settings give the same result when the limits are center ± 3σ, including derived limits. They differ only when LCL or UCL is supplied separately from σ.
A series with an invalid mapping, or with no mapping, has no run rules.
Specification Limits and Capability
Predefined LSL and USL values do two things: they feed the capability indices, and they can be drawn as control lines.
Capability. With predefined parameters, Cp, Cpk, Pp, and Ppk use only the LSL and USL mapped to that series. Cp and Cpk use the supplied process σ instead of an estimate. Pp and Ppk, and the mean in Cpk, still use the observed measurements. Any LSL/USL control lines with a Static or Series position are drawn as visual references but do not count toward capability.
Drawing the lines. In predefined mode, an LSL or USL control line has a third Position input, Predefined, and new specification lines default to it. Pick the Measurement series whose predefined limit the line draws. You can leave it empty when the line's frame has only one configured series. The line is not drawn when the series has no value for that bound, the measurement is missing or ambiguous, or the specification limits are invalid.
Stages and Point Exclusion
Predefined parameters replace every estimate, so there is nothing for stages or exclusions to recalculate:
- Staged control limits: the center line and limits stay the same across stages. Stage dividers are still drawn, and run rules still restart at each boundary.
- Point exclusion: an excluded point cannot move the limits. It is still shown as a hollow marker, never triggers a rule, breaks a run in progress, and is left out of the statistics table and capability indices.
Supplied limits do not change when the dashboard's time range moves, as long as the parameter query keeps returning the same values.
Validation
The editor checks every mapping against the current query results and shows problems in its card. A problem with the control-limit parameters removes that series' control limits and run rules, and the data stays plotted. A problem with the specification limits turns off only the specification lines and capability for that series.
| Check | Affects |
|---|---|
| A measurement series is selected and found in the results | Control limits and run rules |
| Center and σ have values | Control limits and run rules |
| σ is greater than 0 | Control limits and run rules |
| LCL is below UCL, and the center lies between them | Control limits and run rules |
| Every Field parameter resolves to one field holding one constant value | Control limits and run rules (Center, σ, LCL, UCL), or specification limits (LSL, USL) |
| LSL is below USL | Specification limits and capability |
| The series is not configured by another mapping | Control limits and run rules |
When a mapping is valid, its summary line shows the values in force, for example center 50 · σ 2 · LCL 40 · UCL 60 · LSL 38 · USL 64. A limit computed from center and σ is marked (derived).
Predefined Parameters in the CSV Export
In predefined mode, the panel's CSV export gains a Predefined Parameters section with one row per mapping. It records which values were in force and where each came from, so exported limits and violations can be traced back to their source.
| Column | Description |
|---|---|
| Series | The measurement series |
| Center, Center Source | The center line, and value or the query field it came from |
| Process Sigma | σ of individual measurements |
| Zone Sigma | σ of the plotted statistic, used for the zones and derived limits |
| Sigma Source | value or the query field σ came from |
| Sigma Basis | process σ or σ of the plotted statistic |
| LCL, LCL Source | The lower control limit, and value, a query field, or derived |
| UCL, UCL Source | The upper control limit, and value, a query field, or derived |
| LSL, LSL Source | The lower specification limit, and value, a query field, or none |
| USL, USL Source | The upper specification limit, and value, a query field, or none |
| Rule 1 Basis | control limits or center ± 3σ |
| Status | ok, or the validation problems for the mapping |
The mappings and the Calculation setting are saved with the dashboard. Predefined parameters work with both a time and a numeric X-axis.
Predefined parameters are part of SPC Chart PRO. See requirements, licensing, and support.