I-MR-R/S (Between/Within) Chart
The I-MR-R/S, or Between/Within, chart set is a SPC Chart PRO tool for monitoring variation both between and within subgroups.
An Xbar chart assumes the only reason subgroup means differ is the variation within the subgroups. In many real processes that is not true: each batch, lot, or run has its own level, and those levels drift from one to the next by more than the within-subgroup spread would predict. When a stable between-subgroup component is present, Xbar limits based only on within-subgroup variation can be too narrow. Between/within charts estimate limits for subgroup means from the moving range of those means, while separately monitoring variation within subgroups.
When to Use It
Use between/within charts when your data are collected in natural subgroups, such as batches, lots, or production runs, and the process has an expected component of variation between those groups. Frequent Xbar-R violations may indicate this condition, but they can also indicate process changes or unsuitable subgrouping. Investigate the cause before choosing a different chart.
If the subgroups are just convenient samples of one stable stream, a plain Xbar-R or Xbar-S chart is the right tool.
The Three Charts
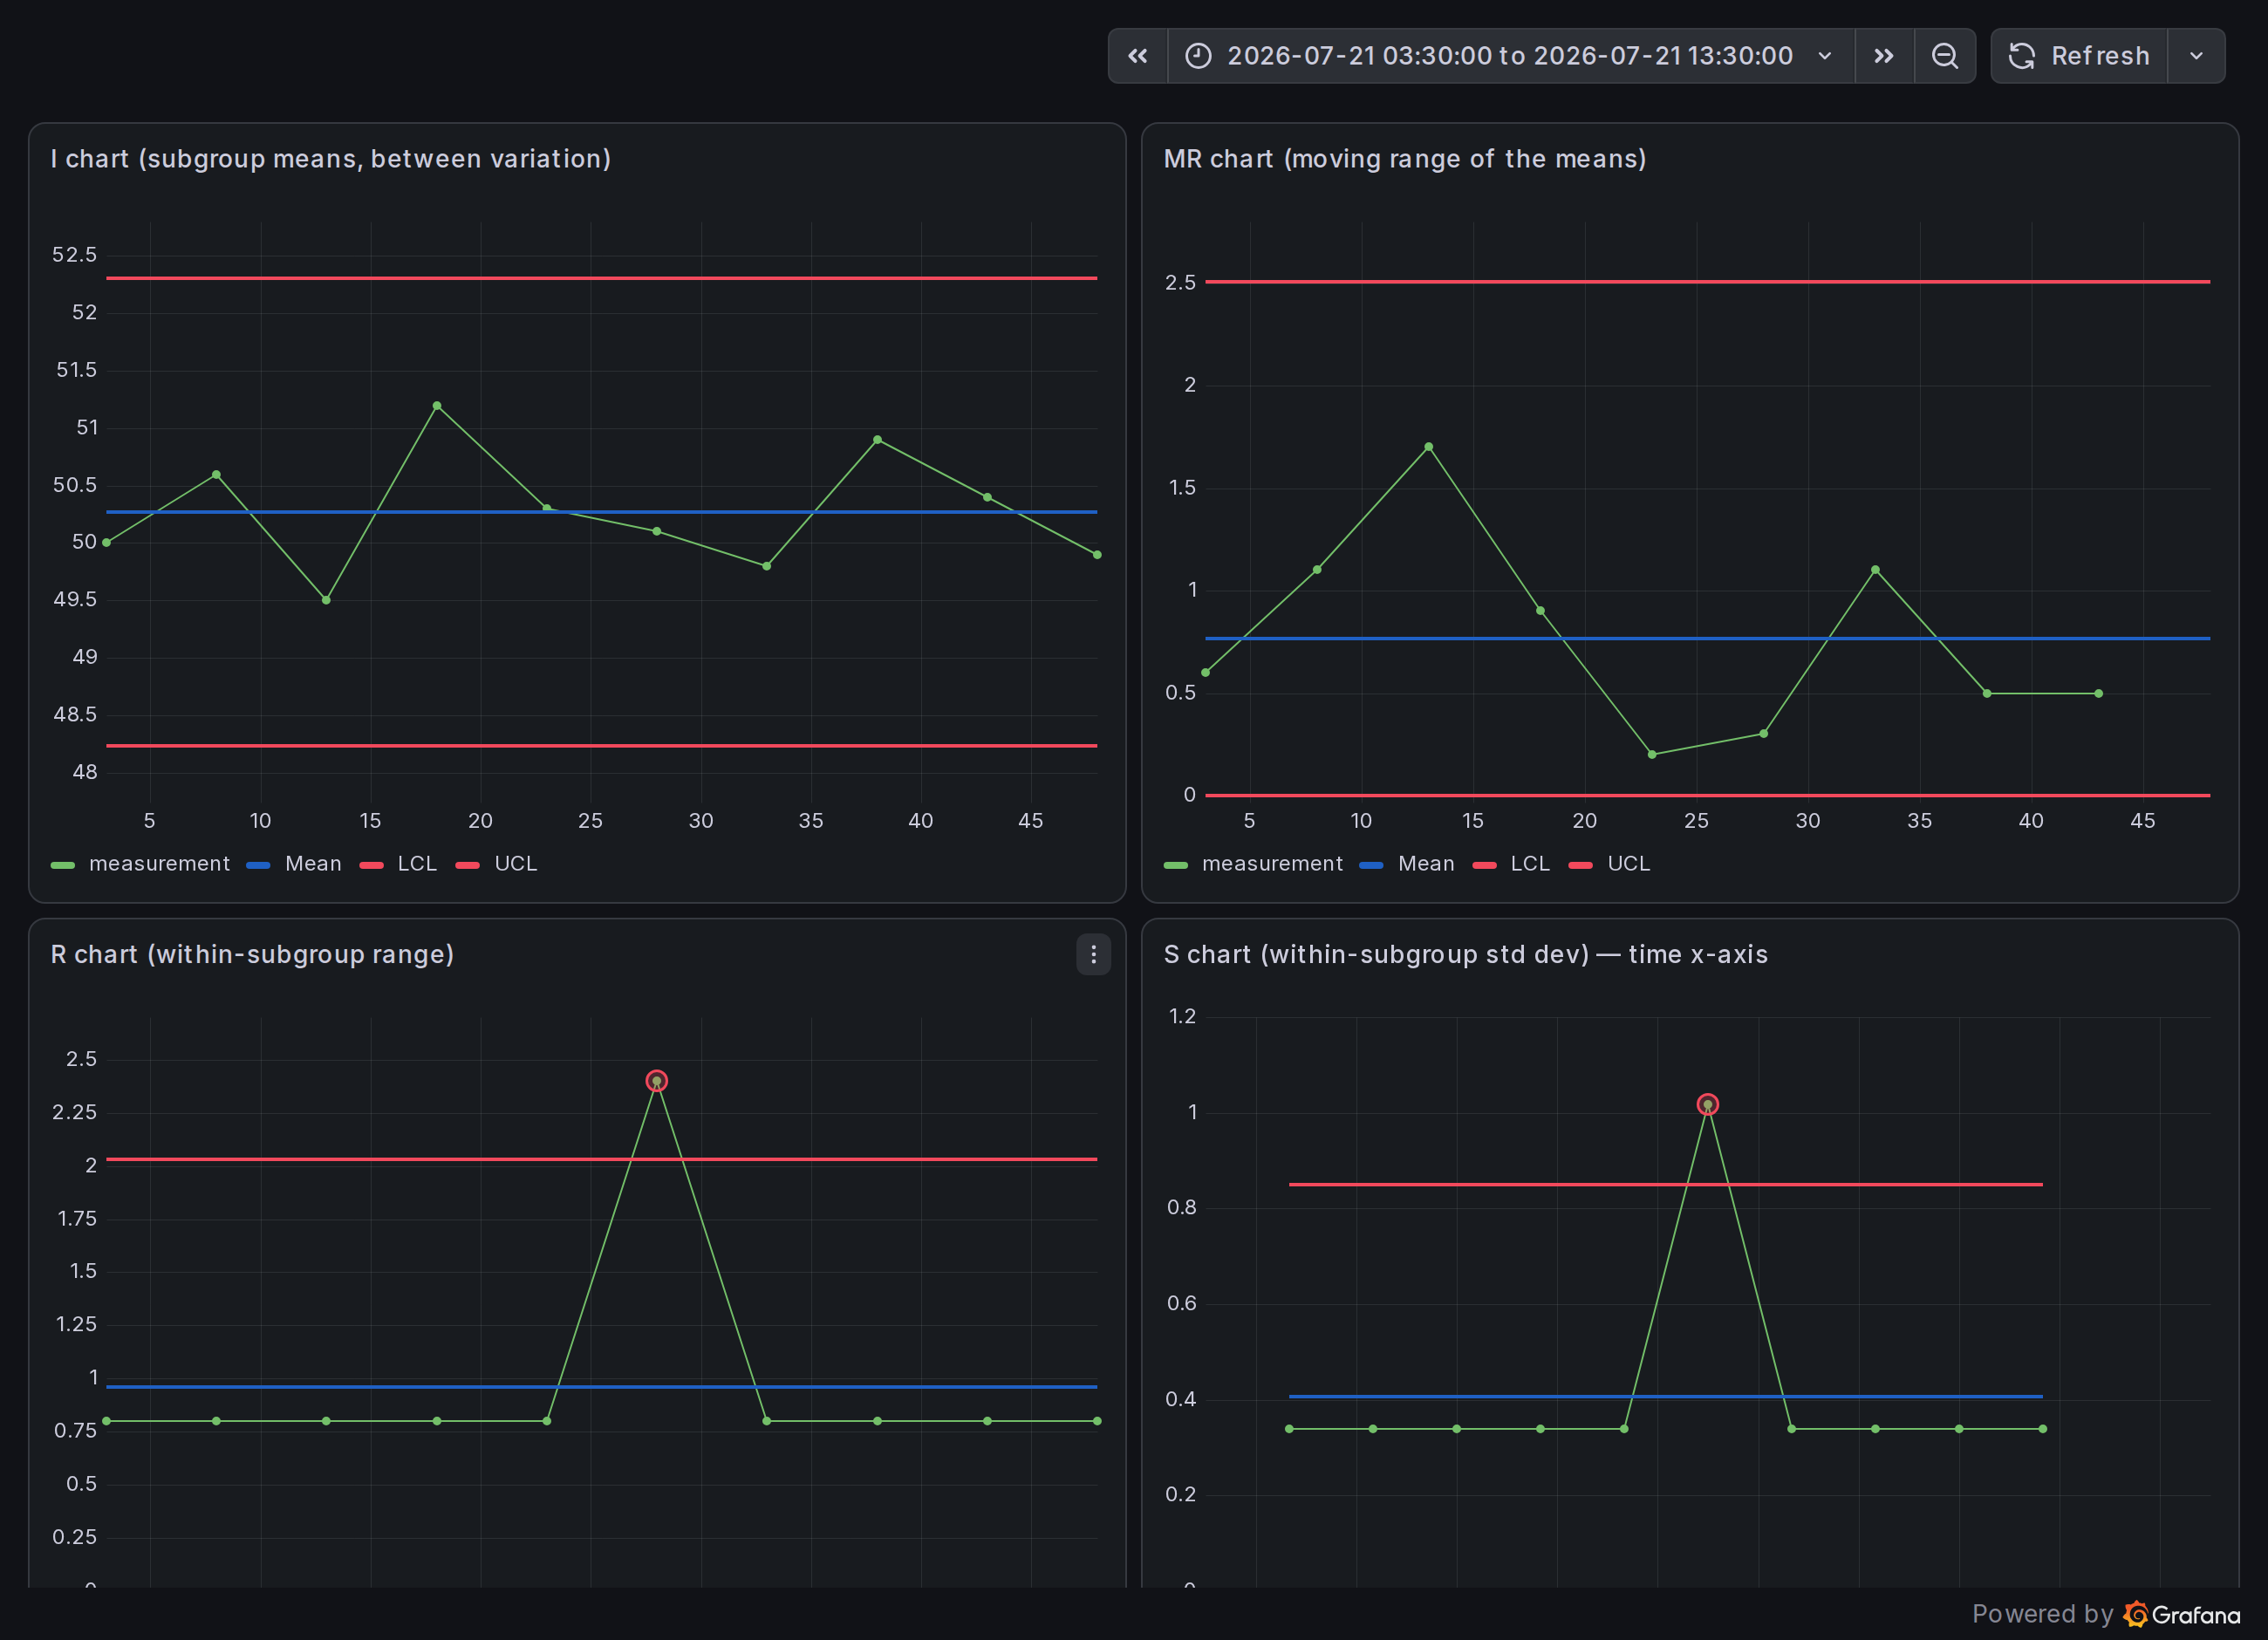
A between/within analysis uses three charts: I, MR, and either R or S. Add each as a separate panel with the same query and subgroup size, then arrange them together on the dashboard.
| Chart Type (in the dropdown) | Plots | Monitors |
|---|---|---|
| I chart (I-MR-R/S between/within) | The subgroup means, as individuals | The process level over time, with limits that include the between-subgroup variation |
| MR chart (I-MR-R/S between/within) | The moving range of the subgroup means | The between-subgroup variation itself — is the batch-to-batch shift stable? |
| R chart / S chart (I-MR-R/S between/within) | The within-subgroup range (R) or standard deviation (S) | The within-subgroup spread — is the variation inside each subgroup stable? |
Read the charts together. The I chart monitors subgroup means, the MR chart monitors changes between consecutive means, and the R or S chart monitors spread within each subgroup. A spike on the R or S chart indicates unusually large variation within that subgroup.
Setting It Up
- Add a panel for each chart you want — typically the I, MR, and one of R / S.
- Point all of them at the same query and set the same Subgroup size in the SPC section. Each consecutive block of that many rows is one subgroup.
- Choose R for small subgroups and S for larger ones — the range is simple and effective up to about 8–10 per subgroup, while the standard deviation uses all the data and is preferred beyond that.
Methods and Formulas
Let X̄ be the grand mean of the subgroup means, MR̄ the average moving range of the subgroup means, R̄ and S̄ the average within-subgroup range and standard deviation, and n the subgroup size.
| Chart | Center line | Control limits |
|---|---|---|
| I (of the means) | X̄ | X̄ ± 2.66·MR̄ |
| MR (of the means) | MR̄ | D4·MR̄ and D3·MR̄ (n = 2 constants) |
| R (within) | R̄ | D4·R̄ and D3·R̄ |
| S (within) | S̄ | B4·S̄ and B3·S̄ |
The I chart's limits use the moving range of the means — the same rounded constant 2.66 (approximately 3 ⁄ d2) as an I-MR chart, applied to the subgroup means — which is exactly how the between-subgroup variation enters. The R and S charts are the same within-subgroup range and standard-deviation charts as in Xbar-R and Xbar-S.
Capability
For capability (Cp/Cpk), the panel estimates the total standard deviation of the individual measurements by combining both components:
σtotal = √( Smr2 + σwithin2·(1 − 1 ⁄ n) )
where Smr = MR̄ ⁄ d2 estimates the standard deviation of the subgroup means and σwithin = S̄ ⁄ c4 is the within-subgroup standard deviation. This between/within estimate applies on any panel of the set. As always, capability needs specification limits.
Between/Within charts take their data in the same shape as any subgrouped chart — one measurement per row, grouped by the Subgroup size. The subgroup size and chart type are saved with the dashboard, and every chart works with both a time and a numeric X-axis.
I-MR-R/S is part of SPC Chart PRO. See requirements, licensing, and support.