CUSUM Chart
The CUSUM (cumulative sum) chart is a SPC Chart PRO chart type for detecting small, sustained shifts in a process.
A Shewhart chart (XmR, Xbar-R) reacts well to large, sudden shifts but is slow to catch a small one that persists. With only the single-point out-of-limit test enabled, a small shift may persist for many points before a value crosses a limit. CUSUM accumulates the deviation of every point from a target, so a small, steady bias can accumulate until a decision limit is crossed.
Select CUSUM chart (time-weighted) in the Chart Type dropdown.
How It Works
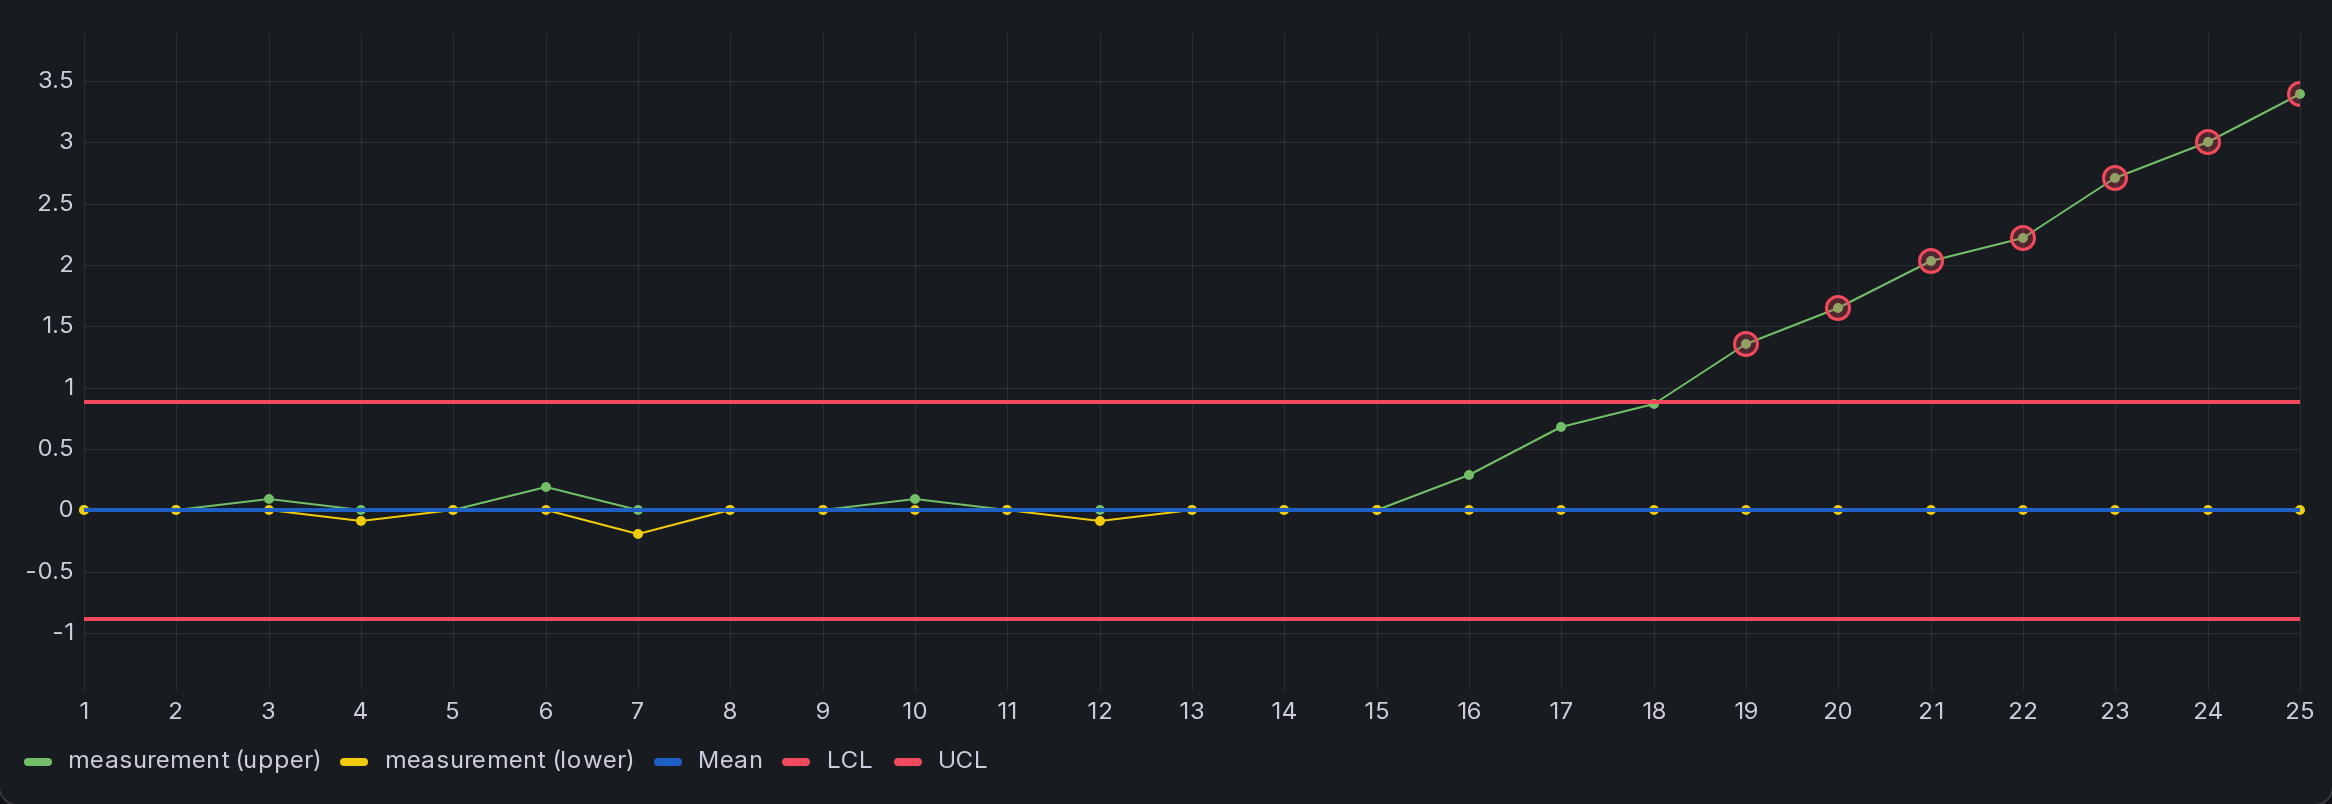
CUSUM runs two cumulative sums in parallel, each drawn as its own line:
- Upper sum (C⁺) accumulates deviations above the target and detects an upward shift.
- Lower sum (C⁻) accumulates deviations below the target and detects a downward shift.
By default, both sums start at zero. Each can move away from zero as deviations accumulate and return toward zero when the observations move in the opposite direction. They share a center line of 0 and symmetric limits, the decision interval ±H. With Rule 1 enabled, a limit crossing is flagged as a signal to investigate.
Two parameters — the reference value and the decision interval — set how large a shift the chart is tuned to detect and how quickly it responds. The defaults are k = 0.5 and h = 4. Tune them together to balance detection speed and false alarms. Average run length (ARL) is the expected number of points before a signal.
Panel Options
CUSUM options appear in the SPC section when the CUSUM chart type is selected.
| Option | Description | Default |
|---|---|---|
| Reference value (k) | Allowance applied to each one-sided sum, in units of σ / √n. A common choice is half the shift size to be detected, in the same units. | 0.5 |
| Decision interval (h) | Distance from zero to each decision limit, in units of σ / √n. Larger values generally reduce false alarms but delay detection. | 4 |
| Target | The process target the deviations are measured from. When empty, the mean of the data is used. | Mean of data |
| Historical σ | The process standard deviation. When empty, it is estimated from within-subgroup variation. | Estimated |
| Fast initial response | Start the sums at ±H⁄2 so a shift already present at start-up is caught sooner. | Off |
Individuals or Subgroups
CUSUM works on individual measurements or on subgroups. Set the Subgroup size in the SPC section: a size of 1 treats each row as one point, while a larger size accumulates the deviation of each subgroup mean and tightens the decision interval by √n.
Reading the Chart
A rising upper sum suggests observations are accumulating above the target; a falling lower sum suggests the opposite. A crossing of +H or −H signals a possible shift in that direction. Examine the preceding observations to investigate when the change may have begun.
Methods and Formulas
For each point i, with subgroup mean x̄ᵢ, target T, and the standard error of the mean σx̄ = σ ⁄ √n:
- Upper sum: C⁺ᵢ = max( 0, C⁺ᵢ₋₁ + (x̄ᵢ − T) − K )
- Lower sum: C⁻ᵢ = min( 0, C⁻ᵢ₋₁ + (x̄ᵢ − T) + K )
where the reference value K = k·σx̄ and the decision interval H = h·σx̄. A point is out of control when C⁺ᵢ rises above H or C⁻ᵢ falls below −H. With Fast initial response enabled, the sums begin at C⁺₀ = +H⁄2 and C⁻₀ = −H⁄2 instead of zero.
Unless Historical σ is supplied, the panel estimates process sigma from the average moving range for individuals or the pooled within-subgroup standard deviation for subgrouped data.
Run Rules on CUSUM
Because each CUSUM point already carries the history of every point before it, the pattern-based Nelson rules — runs, trends, and zone tests — do not apply; they would fire on the accumulation itself. For a CUSUM chart the panel therefore shows only Rule 1, which flags any point beyond the decision interval — exactly the CUSUM out-of-control signal. The remaining rules are hidden automatically.
Point Exclusion on a CUSUM Chart
Point exclusion behaves a little differently on a CUSUM chart than on a Shewhart chart, because the plotted statistic is cumulative.
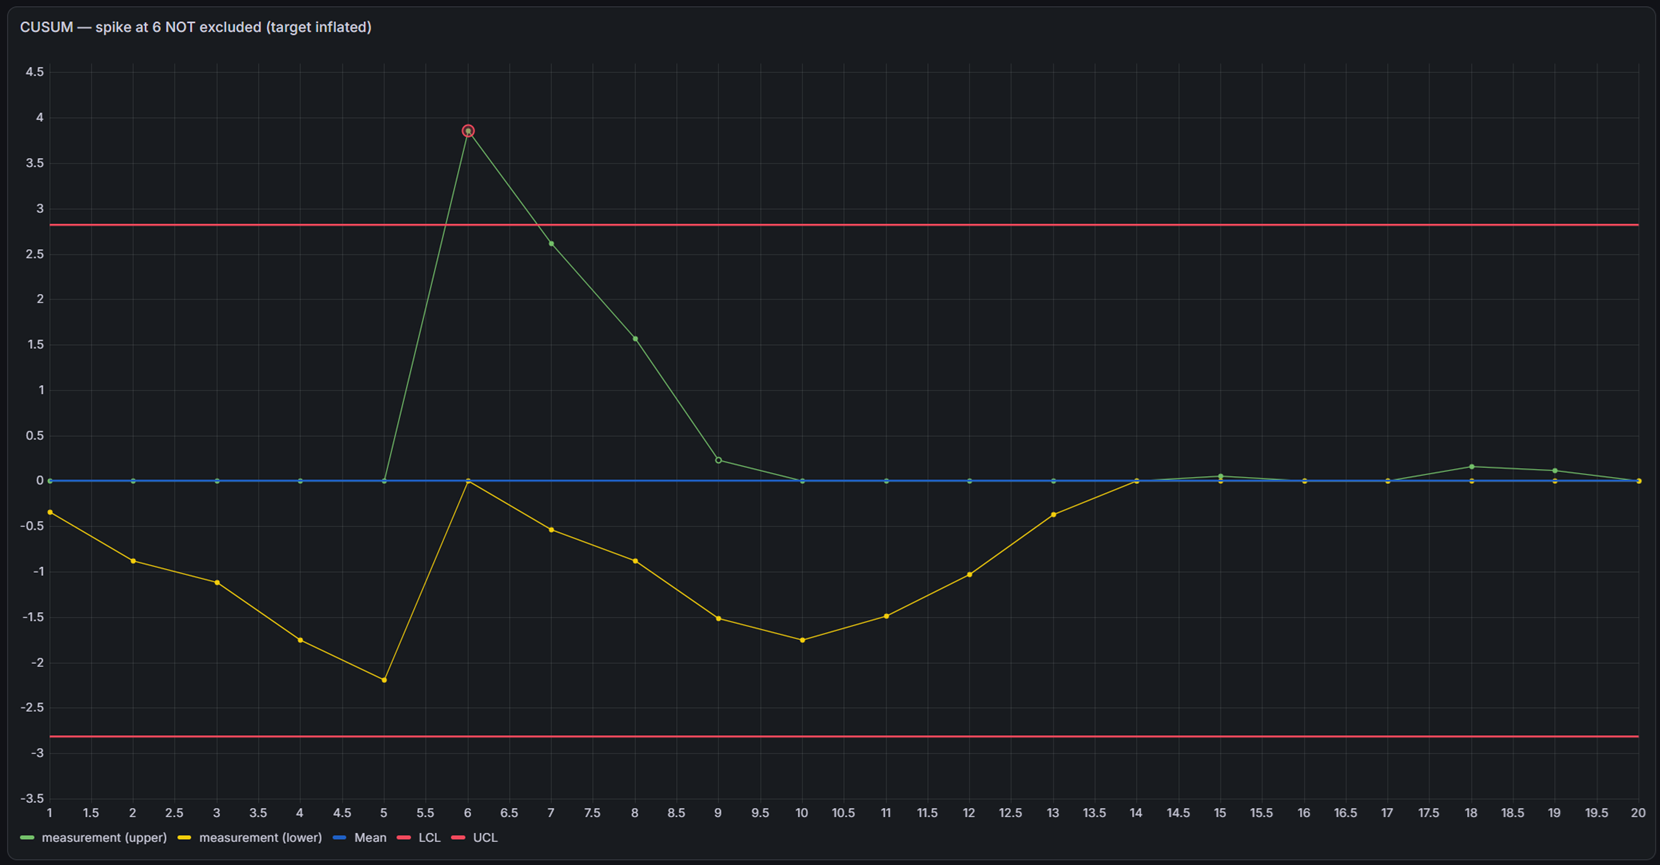
An excluded point is omitted from the target and sigma estimates. The sums and decision interval are then recalculated using those estimates. A supplied target or historical sigma remains unchanged. The point itself stays plotted and remains in the cumulative sum: an excluded spike is still visible on the accumulated line. In other words, excluding a point removes its influence on the limits and target, not from the running total.
This allows a known assignable cause to be omitted from the baseline estimate while retaining its effect on the plotted cumulative sum. The EWMA chart handles exclusion similarly.
The example below shows a spike before exclusion, illustrating how it can affect both the estimated target and the cumulative sums.
When to Use CUSUM
| Scenario | Chart |
|---|---|
| Detecting a small, sustained shift (roughly 0.5σ–2σ) as early as possible | CUSUM |
| Detecting large, sudden shifts | XmR / Xbar-R / Xbar-S |
| Monitoring small deviations from a target over time | CUSUM |
The CUSUM parameters, the target, and the subgroup size are saved with the dashboard. Like every chart type, CUSUM works with both a time and a numeric X-axis.
CUSUM is part of SPC Chart PRO. See requirements, licensing, and support.