EWMA Chart
The EWMA (exponentially weighted moving average) chart is a SPC Chart PRO chart type for detecting small, sustained shifts in a process.
Like the CUSUM chart, EWMA is a time-weighted chart: instead of judging each point on its own, it blends every point with the smoothed history before it. A small, steady bias that no single point would flag builds up in the moving average until it crosses a control limit. EWMA and CUSUM detect the same kinds of shifts — EWMA presents the result as a single smoothed line, which many people find easier to read.
Select EWMA chart (time-weighted) in the Chart Type dropdown.
How It Works
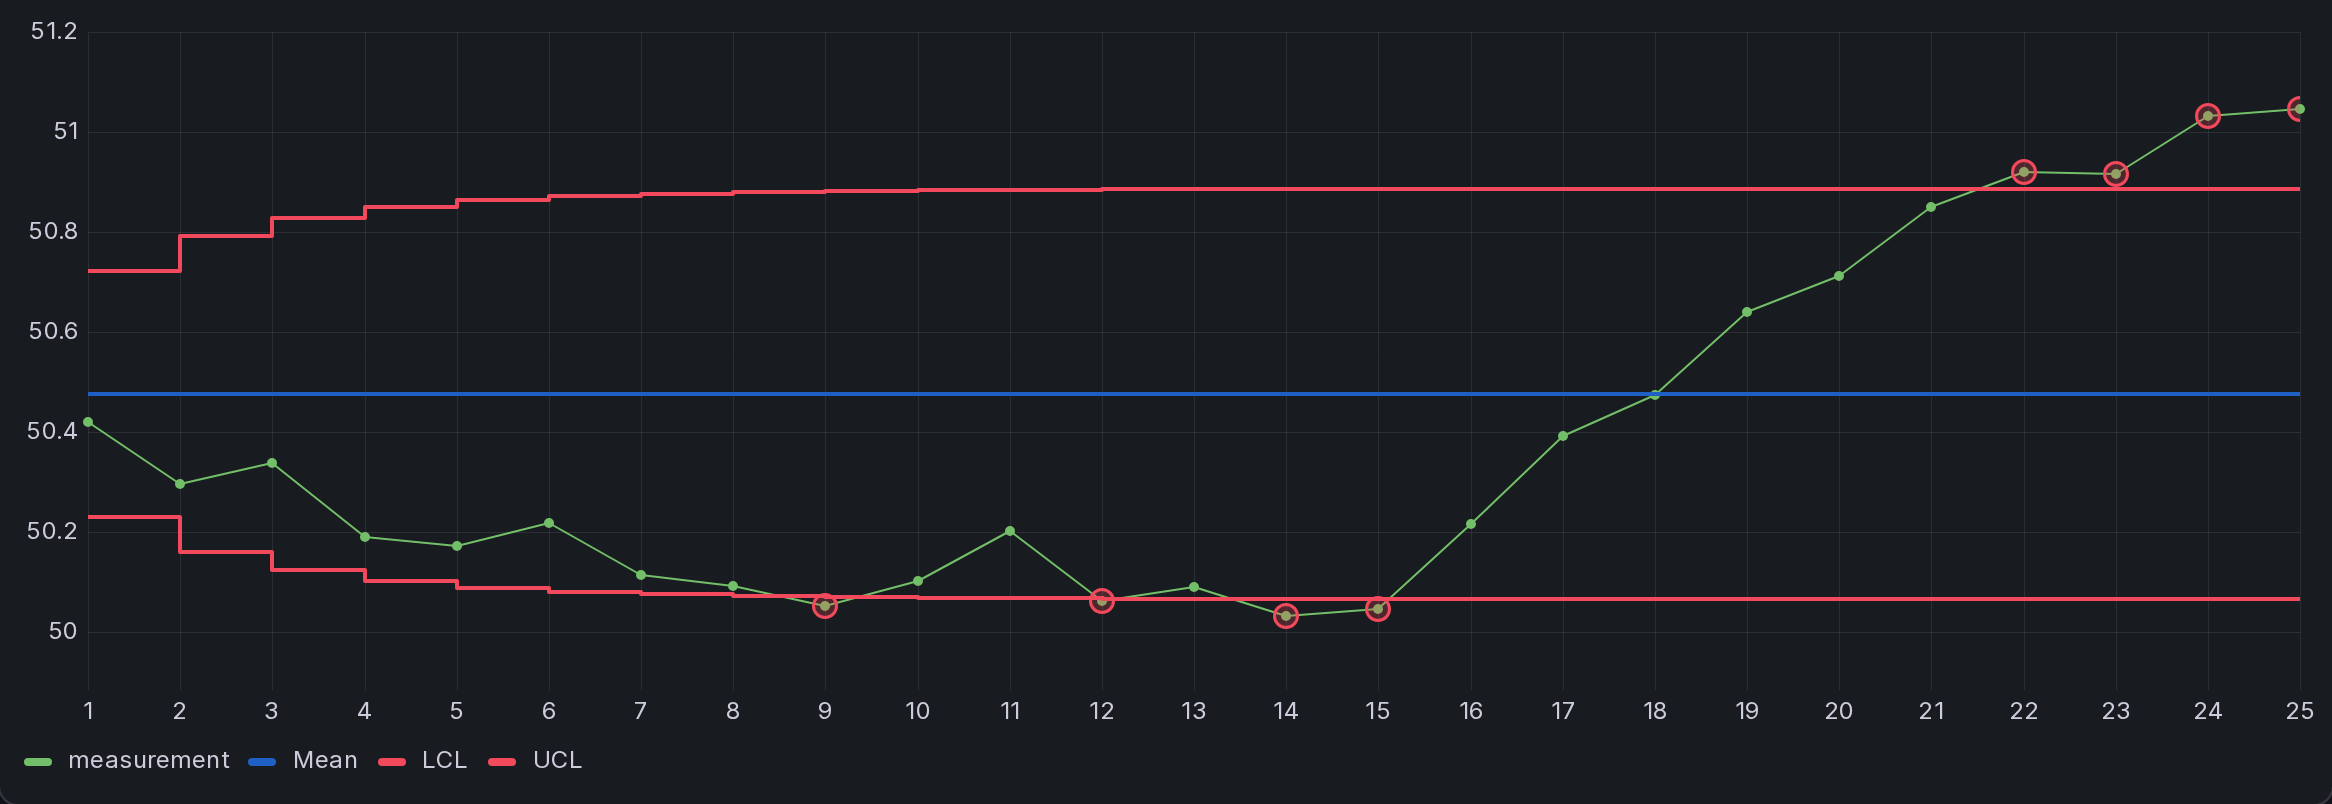
Each plotted point is a weighted average of the current observation and all previous ones, with the weight decaying exponentially into the past: zᵢ = λ·x̄ᵢ + (1 − λ)·zᵢ₋₁.
The weight λ sets how much the newest point contributes. Smaller values give more weight to history and smooth short-term fluctuations. At λ = 1, each plotted point equals the current observation or subgroup mean. The moving average starts at the process mean. Limit width (L) multiplies the standard deviation of the EWMA statistic, which changes during startup.
For λ below 1, the control limits start narrow and widen toward a steady width. Early on the moving average has little history, so its variability is smaller and the limits are tighter; as history accumulates they open to their steady-state width. This is the flared look at the left of the chart.
The defaults are λ = 0.2 and L = 3. Tune the weight and limit width together to balance detection speed and false alarms.
Panel Options
EWMA options appear in the SPC section when the EWMA chart type is selected.
| Option | Description | Default |
|---|---|---|
| Weight (λ) | Weight of the current observation or subgroup mean. The editor offers 0.05–1 in steps of 0.05; smaller values give more weight to history. | 0.2 |
| Limit width (L) | Multiplier applied to the standard deviation of the EWMA statistic when calculating limits. | 3 |
| Historical mean | The center line the average is measured against. When empty, the mean of the data is used. | Mean of data |
| Historical σ | The process standard deviation. When empty, it is estimated from within-subgroup variation. | Estimated |
Individuals or Subgroups
EWMA works on individual measurements or on subgroups. Set the Subgroup size in the SPC section: a size of 1 treats each row as one point, while a larger size smooths the subgroup means and tightens the limits by √n.
Reading the Chart
Read the smoothed line relative to its control limits. A sustained movement toward one limit can indicate a change in the process mean. With Rule 1 enabled, a limit crossing is flagged for investigation. Smoothing delays the response to individual observations, so the signal does not identify the exact point at which a change began.
Methods and Formulas
For each point i, with subgroup mean x̄ᵢ, process mean μ, and the standard error of the mean σx̄ = σ ⁄ √n:
- Statistic: zᵢ = λ·x̄ᵢ + (1 − λ)·zᵢ₋₁, starting from z₀ = μ
- Center line: μ
- Control limits at point i: μ ± L·σx̄·√( (λ ⁄ (2 − λ))·(1 − (1 − λ)2i) )
For λ below 1, the term under the square root approaches λ ⁄ (2 − λ) as i increases, so the limits widen toward a steady width. Unless Historical σ is supplied, the panel estimates process sigma from the average moving range for individuals or the pooled within-subgroup standard deviation for subgrouped data.
Run Rules on EWMA
Because each EWMA point already carries the history of every point before it, the pattern-based Nelson rules — runs, trends, and zone tests — do not apply; they would fire on the smoothing itself. For an EWMA chart the panel therefore shows only Rule 1, which flags any point beyond a control limit. The remaining rules are hidden automatically.
Point Exclusion on an EWMA Chart
Point exclusion works the same way on EWMA as on the CUSUM chart: an excluded point is omitted from the mean and sigma estimates, and the chart is recalculated using those estimates. The point stays plotted and remains in the moving average. Supplied historical parameters remain unchanged.
EWMA vs CUSUM
EWMA and CUSUM both monitor small, sustained shifts. Their relative performance depends on the selected parameters and the shift being monitored.
| Aspect | EWMA | CUSUM |
|---|---|---|
| Plotted | One smoothed line | Two cumulative sums (upper and lower) |
| Reading | Follow the trend of the line | Watch either sum cross its boundary |
| Tuning | Weight λ and limit width L | Reference value k and decision interval h |
Shewhart charts (XmR, Xbar-R, Xbar-S) are commonly used for large, sudden shifts. EWMA and CUSUM are useful when small, sustained shifts are the main concern.
The weight, limit width, historical parameters, and subgroup size are saved with the dashboard. Like every chart type, EWMA works with both a time and a numeric X-axis.
EWMA is part of SPC Chart PRO. See requirements, licensing, and support.