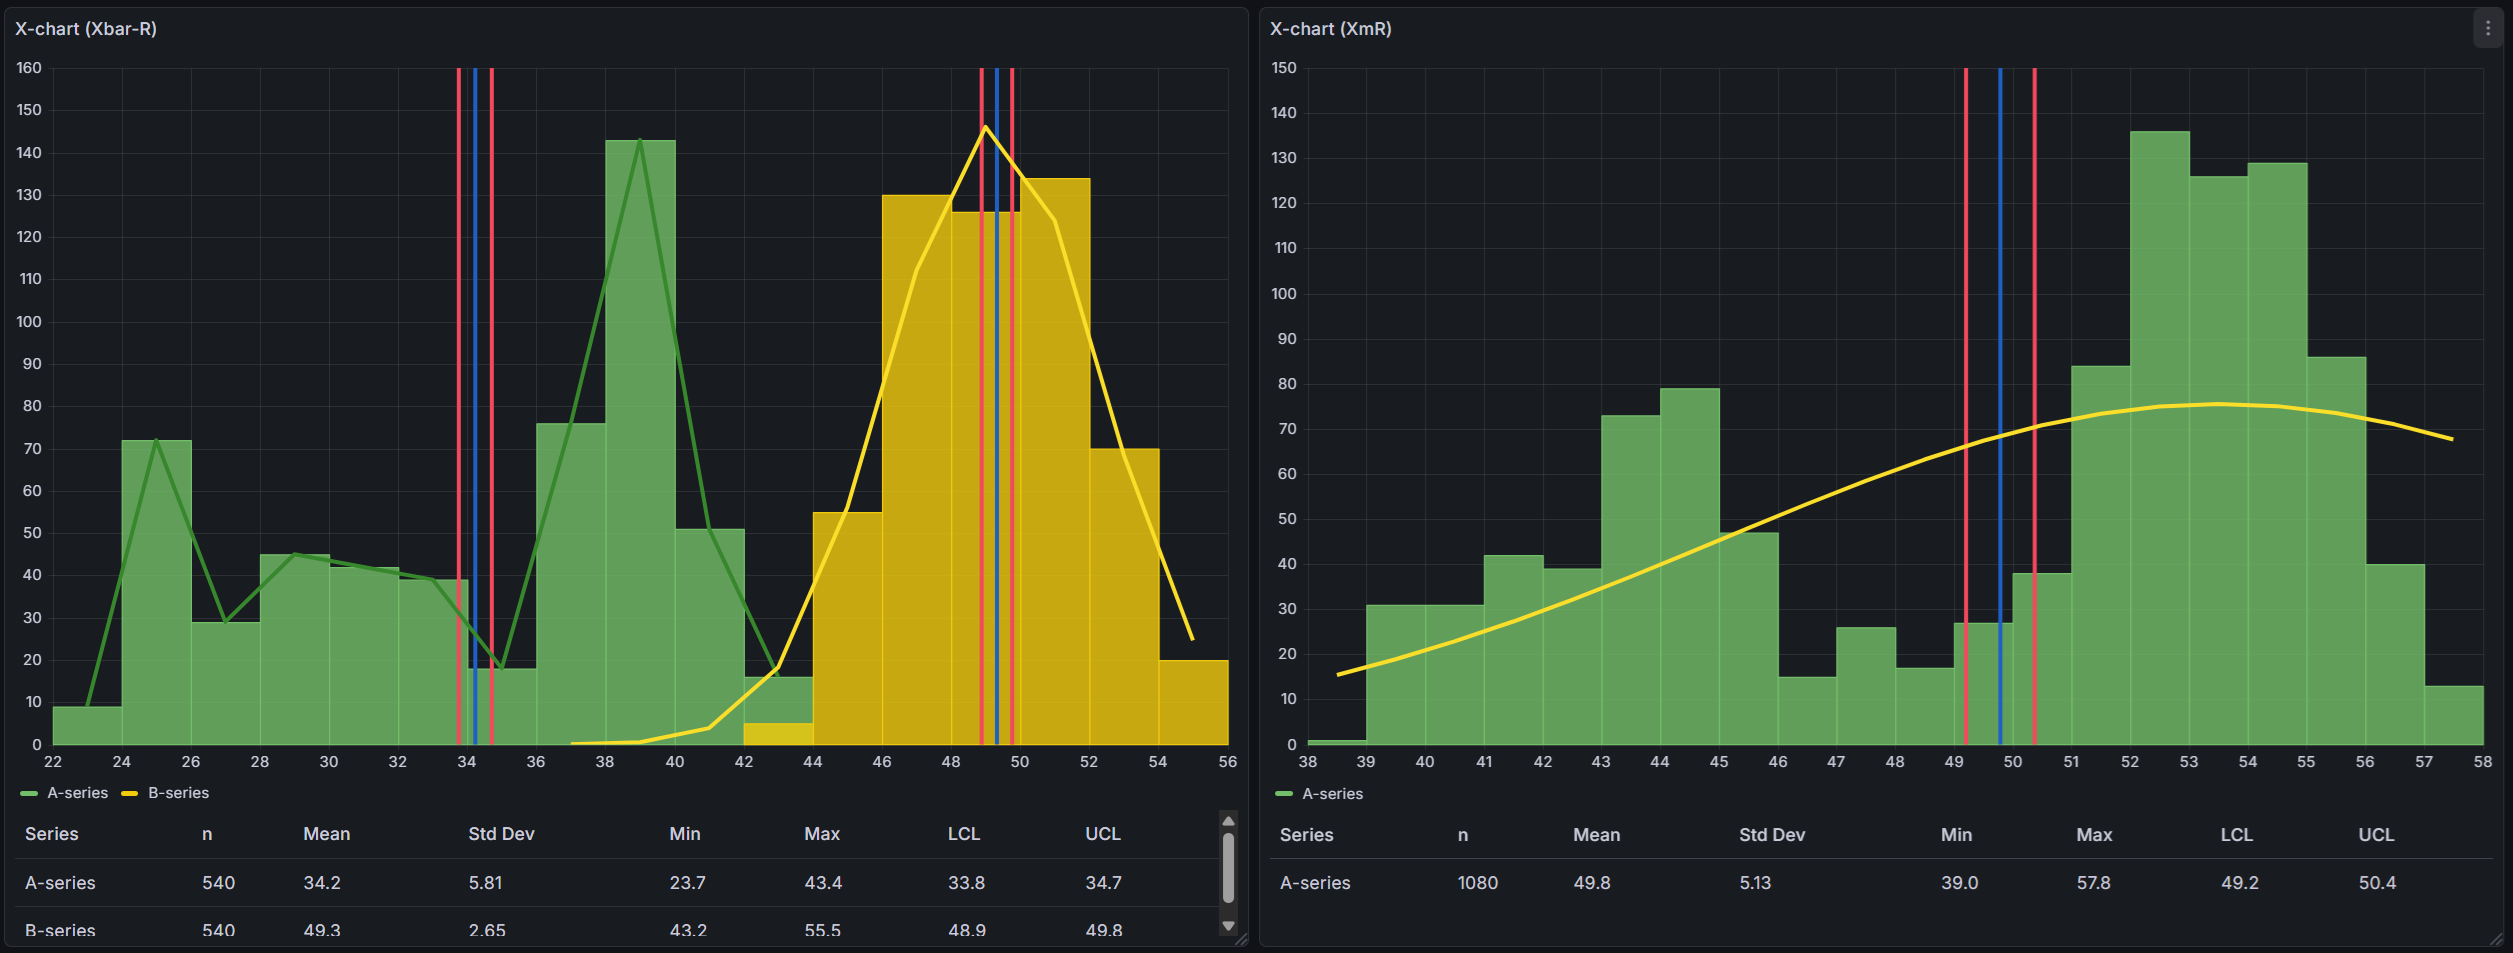
Statistics Table
The SPC Histogram can display a statistics table below the histogram that summarizes key metrics for each data series. This table gives you a quick overview of your process data without needing to calculate anything manually.
Descriptive Statistics
The table always shows the following columns for each series:
| Column | Description |
|---|---|
| Series | The name of the data series |
| n | Number of data points in the series |
| Mean | The average value of all data points |
| Std Dev | Standard deviation — how spread out the values are |
| Min | The smallest value in the series |
| Max | The largest value in the series |
Control Limits
When a control chart type is selected (XmR, Xbar-R, or Xbar-S), the table also shows:
| Column | Description |
|---|---|
| LCL | Lower Control Limit — the lower boundary calculated by the control chart |
| UCL | Upper Control Limit — the upper boundary calculated by the control chart |
These columns only appear when you have a chart type selected (not "none").
Process Capability Indices
Process capability indices tell you how well your process fits within specification limits. They answer the question: "Is my process producing results within the acceptable range?"
These columns only appear when you have defined both a Lower Specification Limit (LSL) and an Upper Specification Limit (USL) as control lines.
| Column | Description |
|---|---|
| Cp | Process capability — can the process fit within spec limits? |
| Cpk | Process capability adjusted for centering — is the process centered? |
| Pp | Process performance — similar to Cp but uses overall variation |
| Ppk | Process performance adjusted for centering — similar to Cpk using overall variation |
What are Cp and Cpk?
Cp measures whether the spread of your process is narrow enough to fit within the specification limits. It uses short-term variation (sigma-hat) estimated from within-subgroup data.
- Cp = 1.0 means the process spread exactly matches the spec width
- Cp > 1.33 is generally considered good — your process fits well within specs
- Cp < 1.0 means the process spread is wider than the spec limits
Cpk is like Cp, but also checks whether the process is centered between the spec limits. A high Cp with a low Cpk means your process is capable but shifted to one side.
What are Pp and Ppk?
Pp and Ppk are similar to Cp and Cpk, but they use the overall standard deviation instead of the within-subgroup estimate. This makes them better for evaluating long-term process performance.
- Use Cp/Cpk to understand short-term process capability
- Use Pp/Ppk to understand long-term process performance
- When Cp and Pp are similar, the process is stable over time
Setting up Specification Limits
To see capability indices in the table, you need to add LSL and USL control lines:
- Go to Editor > SPC > Control Lines
- Click Add Control Line and select LSL (Lower Specification Limit)
- Enter the lower specification value for your process
- Add another control line and select USL (Upper Specification Limit)
- Enter the upper specification value for your process
Once both limits are defined, the Cp, Cpk, Pp, and Ppk columns will appear in the table.
Editor Options
The statistics table can be configured in the panel editor under the Statistics Table section.
Show statistics table — Toggle the entire table on or off. The table is shown by default.
Visible columns — Choose which columns appear in the table. By default, all columns are shown. Use this to simplify the table by hiding columns you don't need. For example, if you only care about basic statistics, you can hide the capability indices.