Control Chart
The SPC Chart automatically calculates and displays control limits, with options to add your own custom limits. It can generate various chart types including XmR, Xbar-R, and Xbar-S, along with customizable control lines and aggregation options, enabling comprehensive process monitoring and analysis.
Control Lines
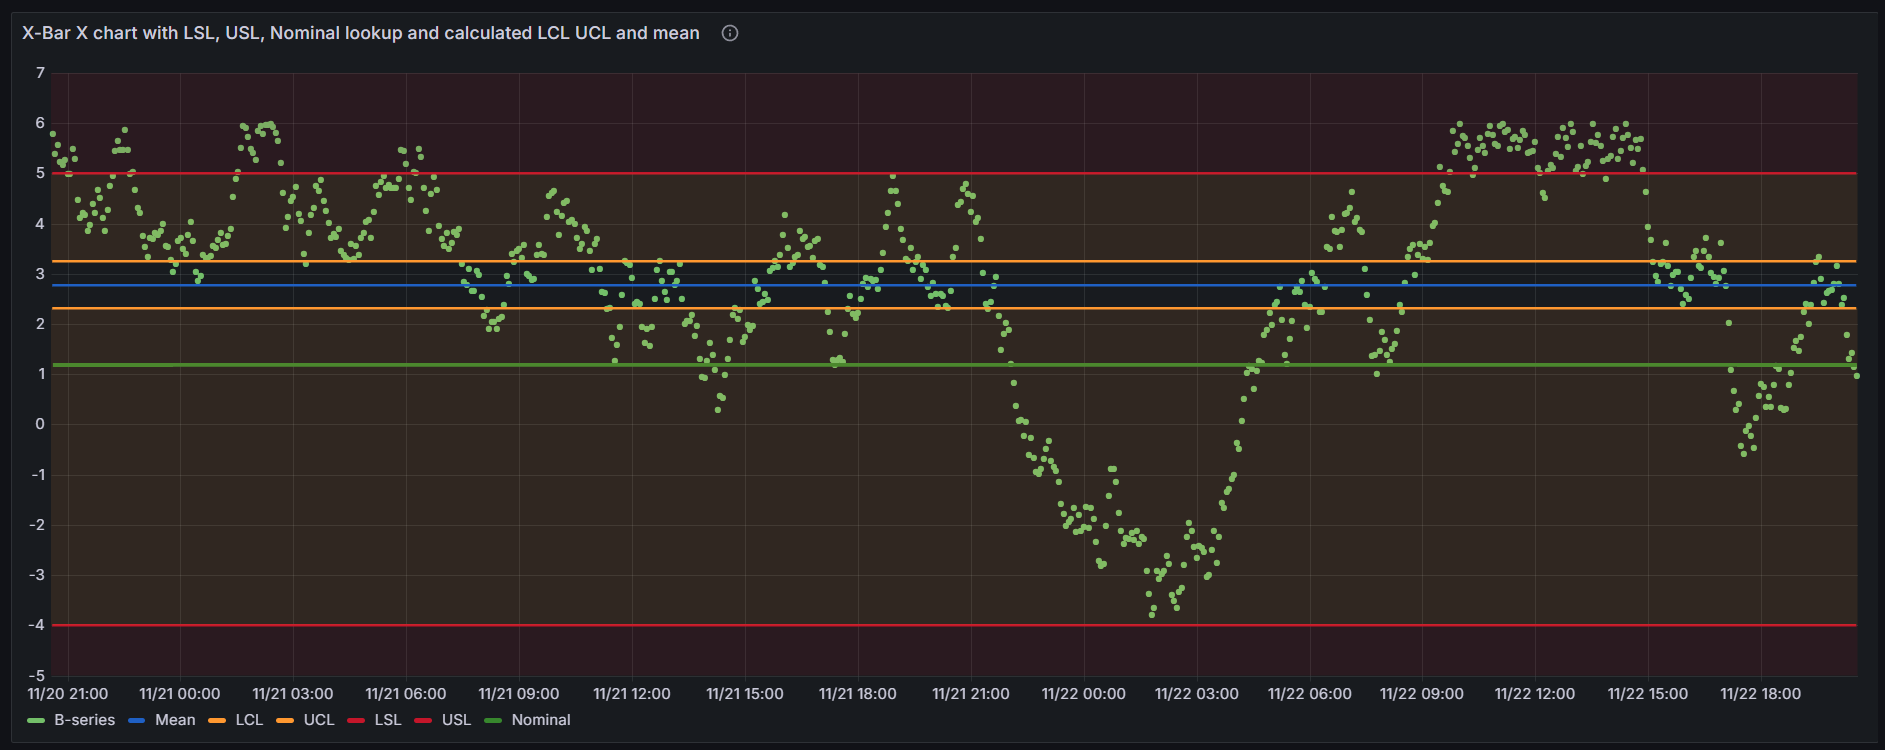
A control line is a horizontal line that shows a limit or threshold. You can add custom control line values or use ones calculated from the dataset.

Calculated
- LCL - Lower Control Limit, marking the lower boundary of the control chart.
- UCL - Upper Control Limit, marking the upper boundary of the control chart.
- Min - Minimum of the sample values.
- Max - Maximum of the sample values.
- Mean - Average of all the sample values.
- Range - Difference between the highest and lowest sample values.
Custom
In the SPC Chart panel, there are two types of custom lines you can add:
- Static Value - Where you manually input a value for the control line.
- Feature Series - Where the line's value is dynamically pulled from your feature dataset. This enhances the flexibility of your charts by integrating limits or custom calculations dynamically from your dataset.
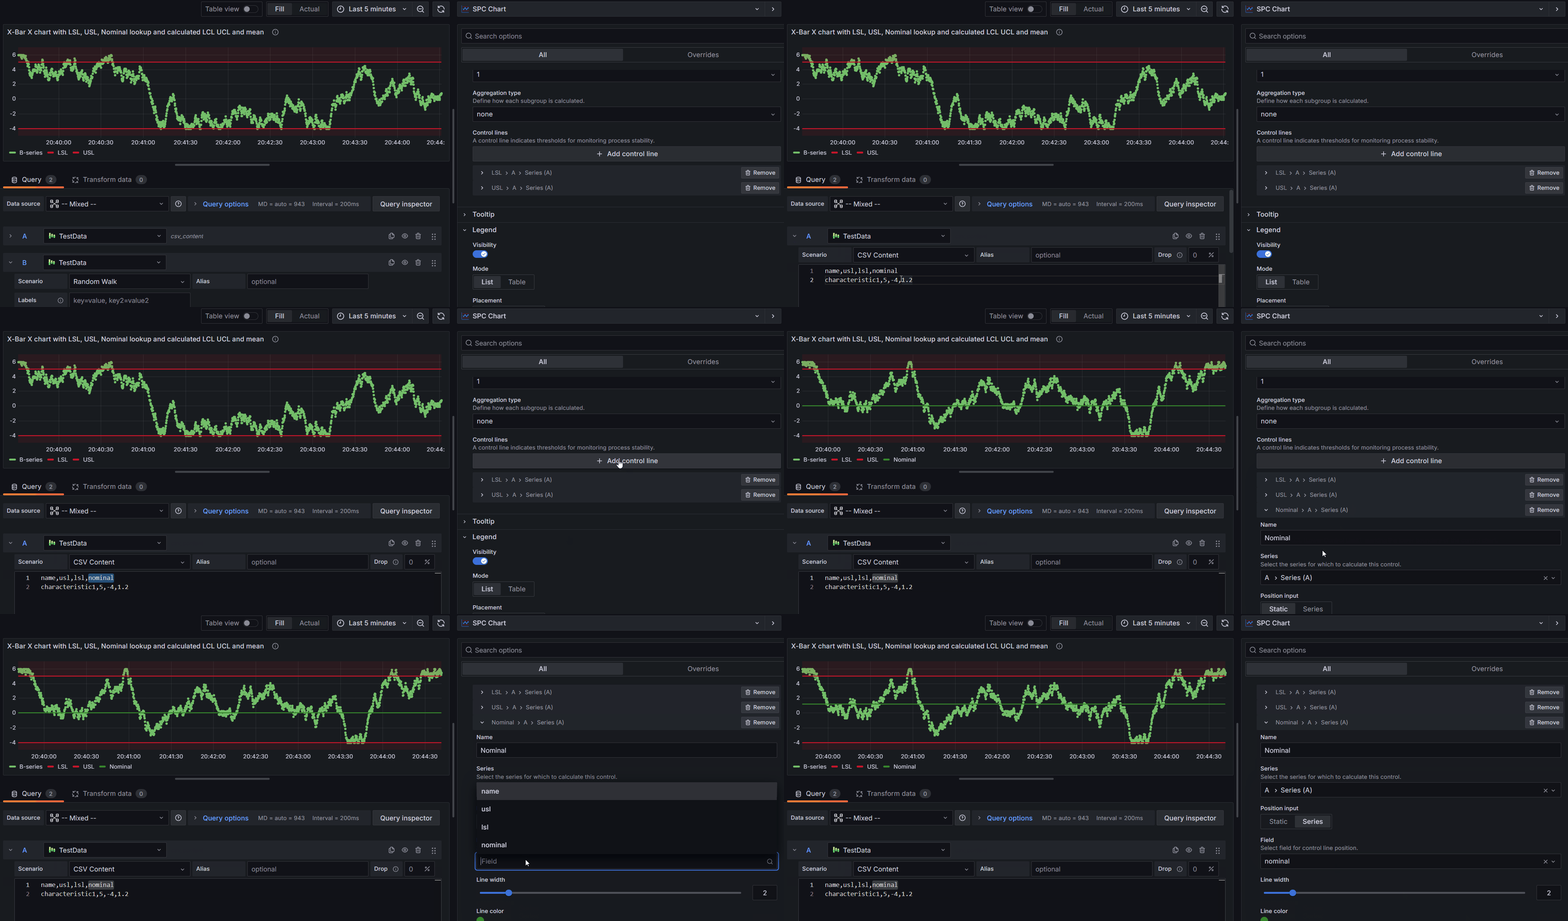
How to Add a Custom Control Line with Field Lookup

-
Setup Your Queries:
- Create at least two queries in your data source:
- One query for the time series data you wish to visualize.
- Another query for the control limits or any reference values.
- Create at least two queries in your data source:
-
Configure the Chart:
- By default, the SPC Chart will attempt to calculate using all time series values (time + value) from all queries. If a query returns a table without time and value, it will be used as a reference. Sometimes, you may have time and value in the reference query but don’t want it included in calculations. To exclude a query meant only for reference (like control limits):
- Navigate to Editor > Overrides > Add Field Override.
- Select the query that contains your control limits or reference data.
- Press Add Override Property and search for Hide in Area.
- Select all three: Tooltip, Viz, and Legend.
- By default, the SPC Chart will attempt to calculate using all time series values (time + value) from all queries. If a query returns a table without time and value, it will be used as a reference. Sometimes, you may have time and value in the reference query but don’t want it included in calculations. To exclude a query meant only for reference (like control limits):
-
Add a Control Line:
- Click on Add Control Line and select Custom.
- In the Series dropdown, choose the query that contains your reference or control limit data.
-
Set Position:
- Under Position Input, select Series.
- A Position dropdown will appear, displaying all available numeric fields from the selected series. Choose the field that represents your control limit.
-
Visualization:
- Once a numeric field is selected, it will appear as a horizontal line on the chart, representing the control limit or any other reference value.
If the selected field from your series returns more than one value, the SPC Chart will use the last value for the control line.
Hide your reference query in the Overrides section to prevent it from showing up in the main chart.
Visualization
You can change how a control line looks:
- Name - Display name of the control line.
- Position - X-axis position where the control line is drawn.
- Series - Select the series for which to calculate the control (if you have more than one).
- Line Width - Line thickness from 0 to 10.
- Color
- Fill - Left fill, no fill, or right fill.
- Fill Opacity
Aggregation
When the Chart Type is set to None, you can choose an Aggregation Type. This option lets you create new data series from the raw time series values. The available types of aggregation depend on the Subgroup Size you pick.
For example, if you select a Subgroup Size of 5 and choose Mean as the aggregation type, the raw data will be split into groups of 5. Then, the average of each group will be calculated. The resulting series will be used to create the chart.
Subgroup Size = 1
- None
- Moving Range
Subgroup Size > 1
- Mean
- Range
- Standard Deviation
Dashboard Variable
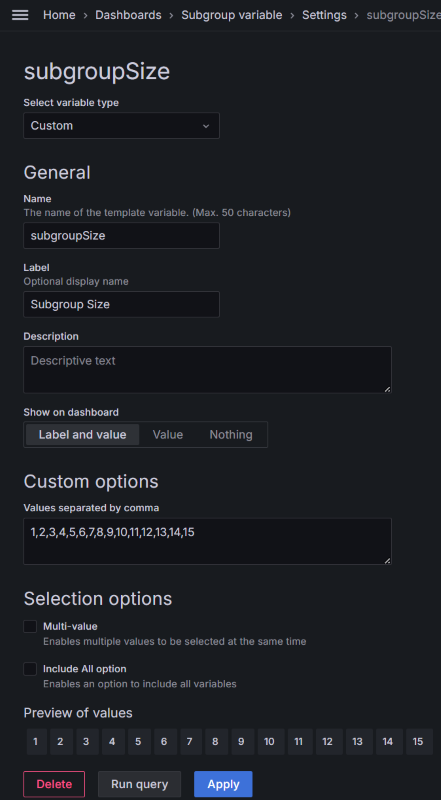
The SPC Chart feature includes built-in support for a dashboard variable called subgroupSize. This allows you to control the subgroup size for multiple instances of an SPC Chart panel using a single dashboard variable. To use this functionality, simply create a dashboard variable named subgroupSize.

Chart Types

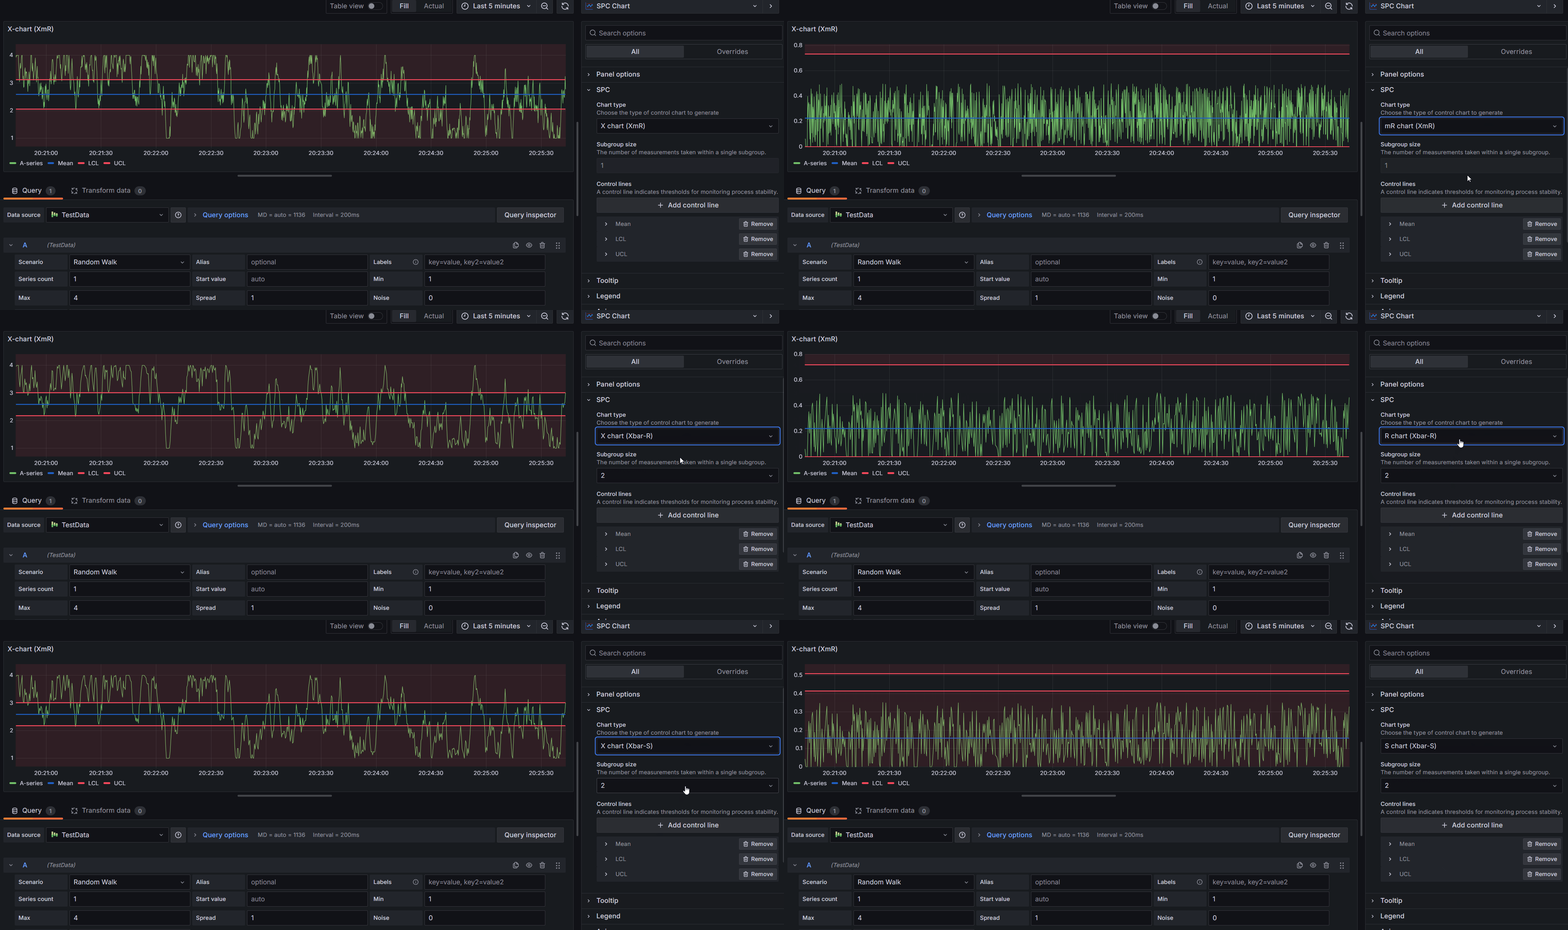
XmR Control Chart
The XmR Control Chart (also called Shewhart's Control Chart or I-MR) tracks process variability based on samples taken over time. It consists of two charts: the individual (X) chart and the moving range (mR) chart. This chart is useful when it's hard to use rational subgroups, such as in automated processes.
Individual (X) Chart
The individual chart shows each data point over time, helping analyze central location. It reveals whether the process centers around a mean value.
Moving Range (mR) Chart
The moving range chart displays the difference between consecutive readings, showing process variability. The chart's average and upper control limit (UCL) help spot unusual patterns or shifts in the data.
Xbar-R Control Chart
The Xbar-R Control Chart is used when you have subgroups of data. It consists of two charts: the X-bar chart and the R-bar chart. This chart is useful for processes where you can collect samples in small subgroups.
X-bar Chart for Xbar-R
The X-bar chart plots the average (mean) of each subgroup over time. It helps monitor the central tendency of the process. The control limits on this chart are based on the average range of the subgroups.
R-bar Chart for Xbar-R
The R-bar chart plots the range of each subgroup over time. It helps monitor the variability within the subgroups. The control limits on this chart are based on the average range of all subgroups.
Xbar-S Control Chart
The Xbar-S Control Chart is similar to the Xbar-R chart but uses standard deviation instead of range to measure variability. It's often preferred for larger subgroup sizes (typically more than 10).
X-bar Chart for Xbar-S
This chart is identical to the X-bar chart in the Xbar-R system. It plots the average of each subgroup over time. However, the control limits are calculated using the average standard deviation instead of the average range.
S-bar Chart for Xbar-S
The S-bar chart plots the standard deviation of each subgroup over time. It helps monitor the variability within the subgroups. The control limits on this chart are based on the average standard deviation of all subgroups.
Using Xbar-S charts instead of Xbar-R charts can provide more sensitive detection of changes in process variation, especially for larger subgroup sizes.