SPC Bullet
The Bullet panel is a versatile bar visualization for Grafana that works as a progress bar, bar gauge, or a full bullet chart with qualitative background zones. Add a target marker to compare actual vs. goal, and optionally enable SPC (Statistical Process Control) metrics — Cp, Cpk, Pp, Ppk, Sigma Level, and more — to go beyond the last value and display meaningful process performance at a glance.
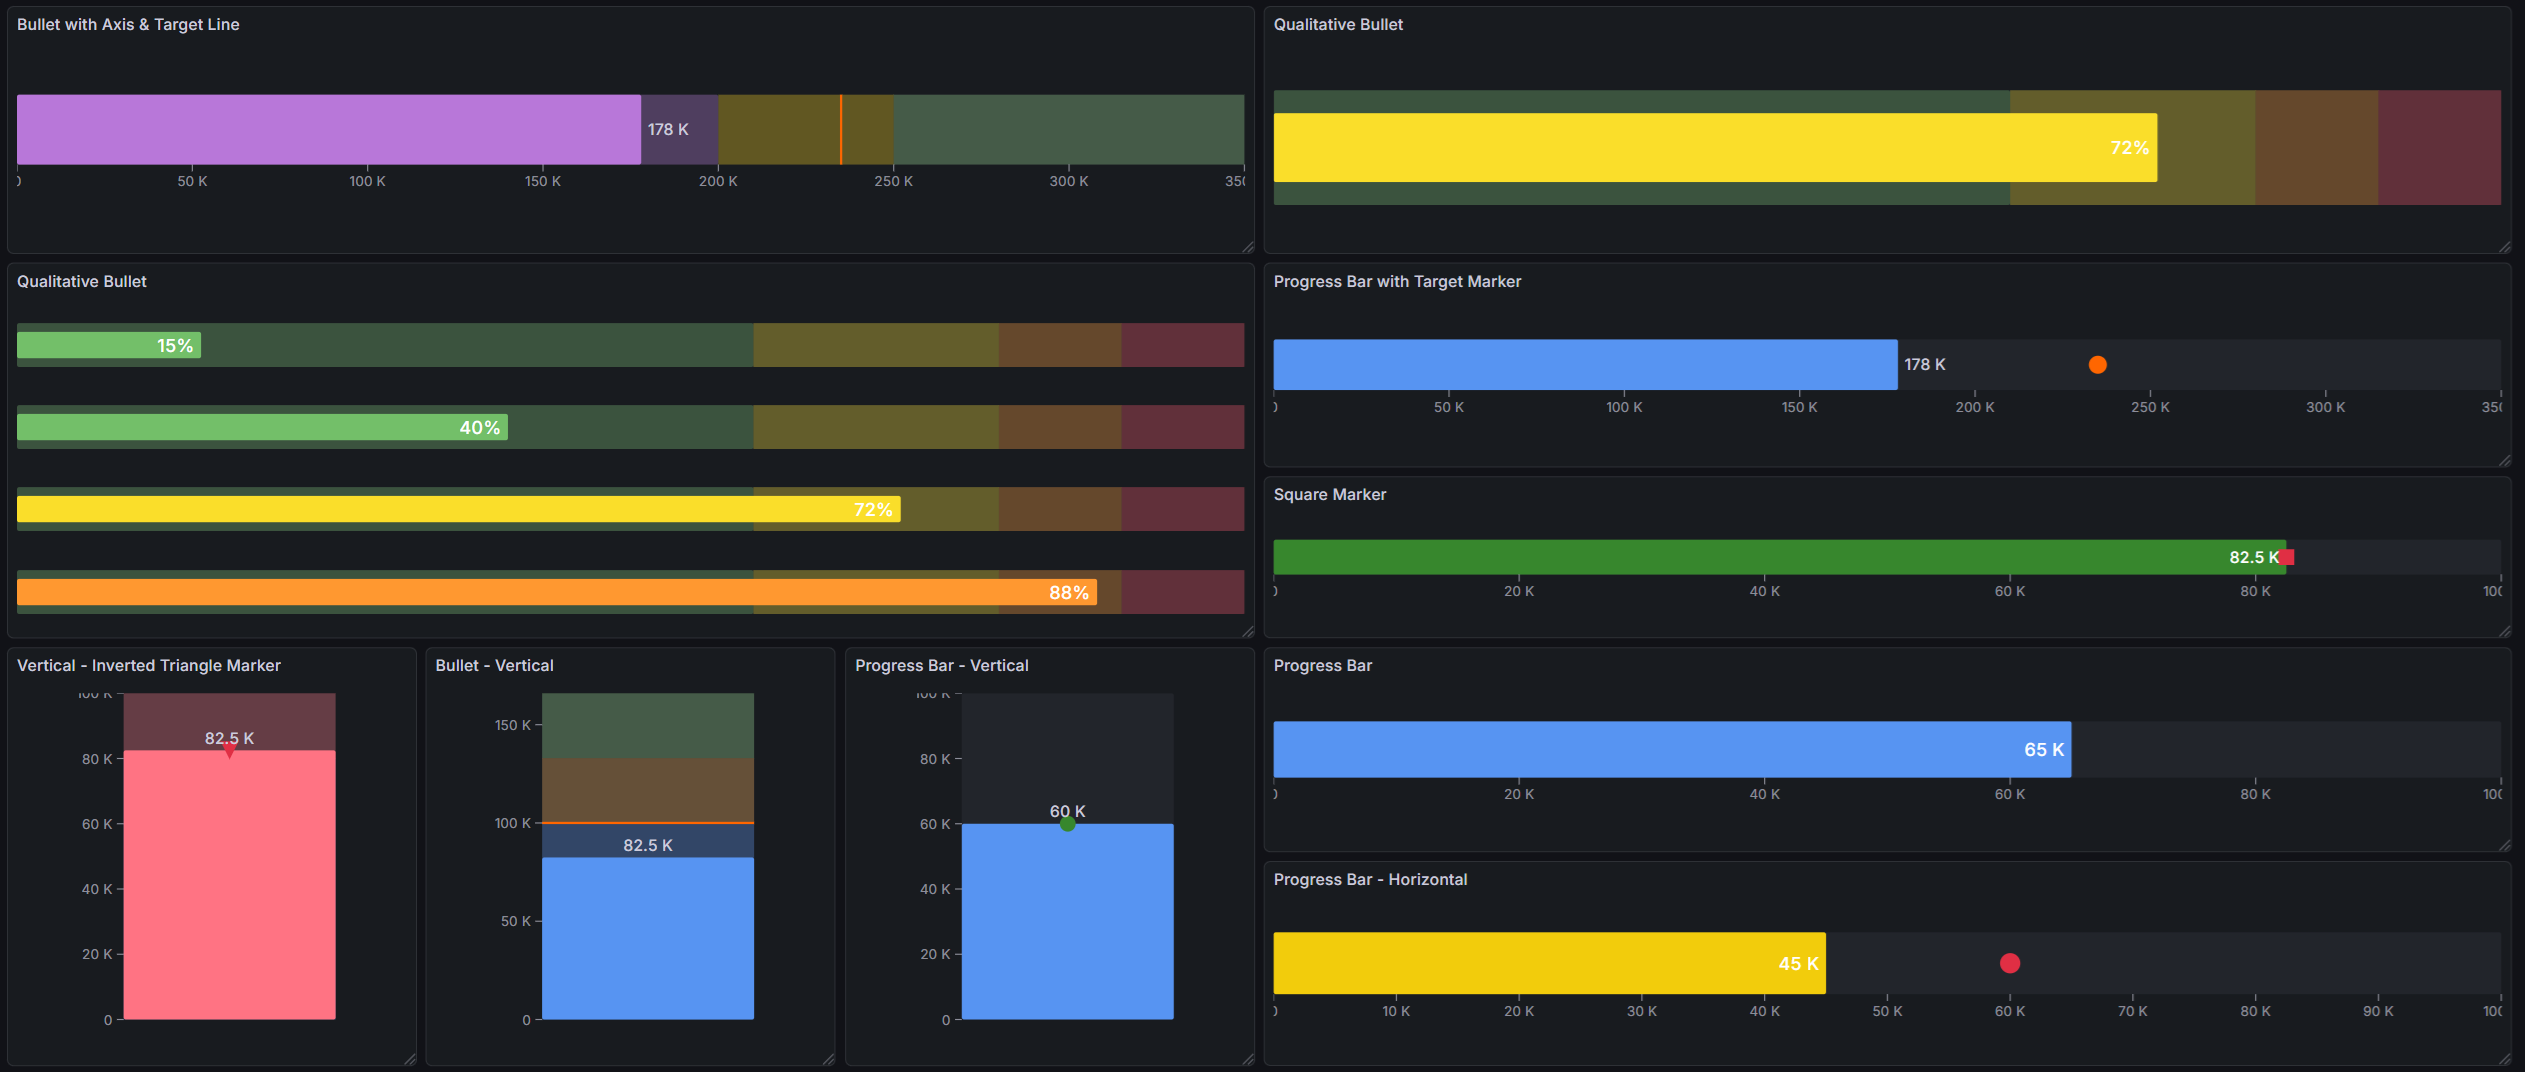
Table of Contents
- Why SPC Bullet?
- Built for Grafana
- Features
- Use Cases
- Requirements
- Getting Started
- Visualization Mode
- Orientation
- Bar Sizing
- Value Label
- Axis
- Target Marker
- SPC Mode (Optional)
- Threshold-Based Coloring
- Multi-Series Layout
- Configuration Reference
- Part of the KensoBI SPC Suite
- Getting Help
- License
Why SPC Bullet?
Bullet charts were invented as a compact, information-dense alternative to gauges. In a single bar you can communicate:
- Where you are — the filled bar shows the current value
- Where you should be — a target marker shows the goal or specification
- How good that is — qualitative background zones (red/yellow/green) show the performance context
With the optional SPC mode, the panel goes further. Instead of showing the last raw measurement, you can display statistical metrics computed from an entire time series — process capability, standard deviation, or mean — directly as the bar value. This makes it easy to build compact KPI dashboards that summarize process health without leaving the Grafana interface.
Built for Grafana
SPC Bullet is built using Grafana's native visualization components. This means it inherits the look, feel, and behavior you already know:
- Native theming — automatically adapts to light and dark mode.
- Standard field options — min, max, units, decimals, and field overrides work just like any other Grafana panel
- Threshold integration — fill color and background zones are driven by Grafana's built-in threshold editor
- Works with any data source — use it with SQL databases, Prometheus, InfluxDB, CSV files, or any other Grafana data source
Features
| Feature | Description |
|---|---|
| Progress bar mode | Simple filled bar showing a value relative to min/max |
| Bullet chart mode | Filled bar with semi-transparent qualitative background zones from thresholds |
| Target marker | Secondary marker from a data field — shows goal, nominal, or spec target |
| 6 marker shapes | Line, Circle, Diamond, Triangle, Inverted Triangle, Square |
| Horizontal & vertical | Full support for both orientations |
| Value label | Numeric value displayed inside or outside the bar with configurable font size |
| Axis | Optional scale axis with configurable tick count and smart number formatting |
| Threshold-based color | Fill color derived from Grafana thresholds, evaluated against displayed value |
| SPC metrics | Mean, Std Dev, Cpk, Cp, Ppk, Pp, Sigma Level — computed from the full series |
| Specification limits | LSL and USL for capability and sigma level calculations |
| Multi-series support | One bullet per data series, stacked automatically |
Use Cases
- Manufacturing KPIs — display Cpk or Ppk for each process parameter on a single dashboard page
- OEE dashboards — show availability, performance, and quality as bullet bars against targets
- Production progress — track shift output vs. daily target with a compact progress bar
- Quality scorecards — summarize process health across many parameters in a grid of bullets
- IT operations — monitor SLA compliance (e.g., uptime %) with clear red/yellow/green zones
- Laboratory — display capability indices against specification limits for each measured characteristic
Requirements
- Grafana 11.6.2 or later
Getting Started
- Install the SPC Bullet plugin from the Grafana plugin catalog or build it from source.
- Add a new panel to your dashboard and select Bullet as the visualization type.
- Configure a data source query that returns numeric data.
- Set Min and Max in the field configuration to define the bar scale.
- Optionally configure Thresholds to add color zones and background ranges.
- To show a target marker, add a second query or field and select it under Target marker > Field name.
- To display an SPC metric (e.g., Cpk) instead of the last value, enable it under SPC > Metric.
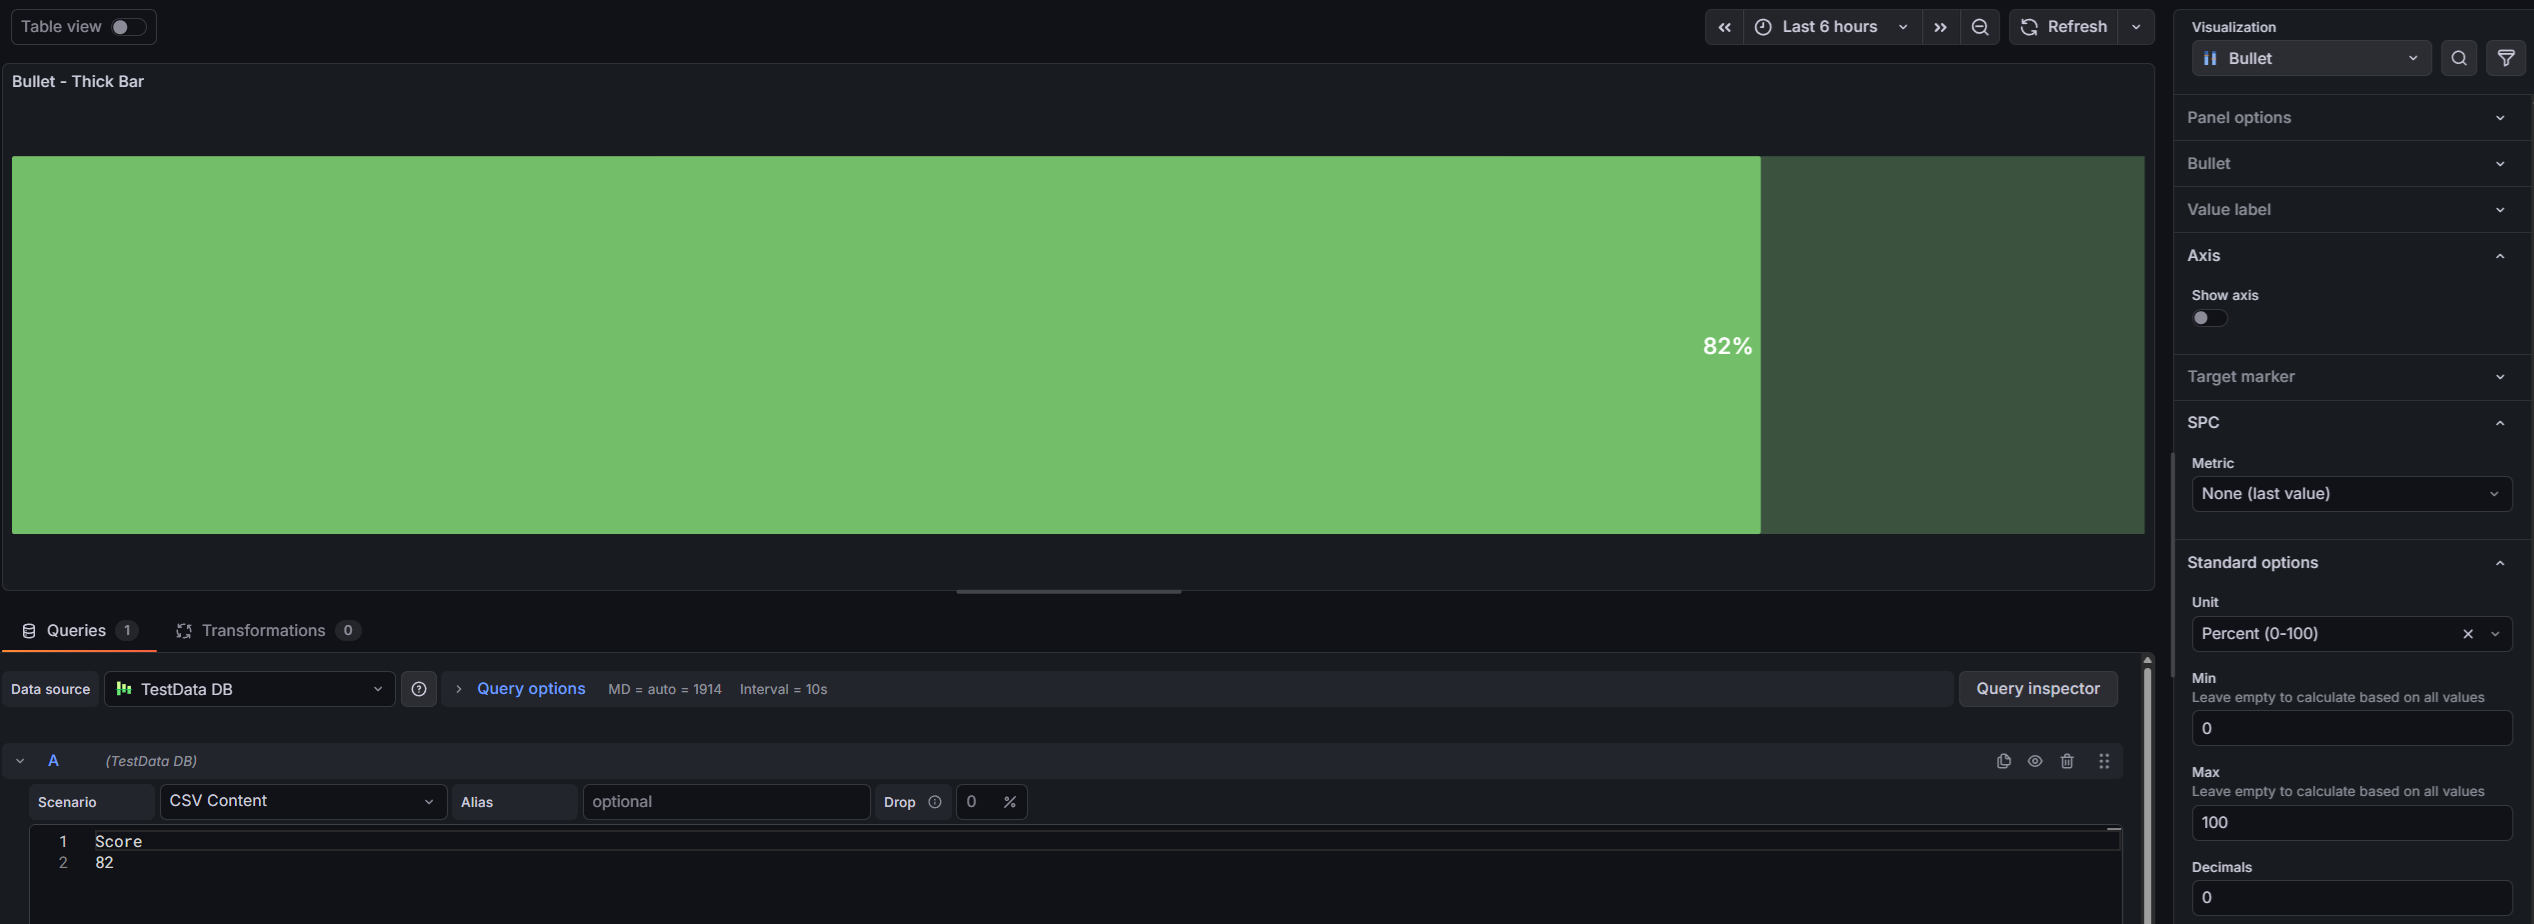
You must explicitly enter Min and Max values in Field > Standard options. If left empty, Grafana auto-computes the scale from your data values — for example, if your data value is 82 500, the scale starts at 82 500 and the bar appears empty.
The defaults are Min = 0 and Max = 100. Simply open the Standard options section and confirm the values even if you are happy with the defaults.
Visualization Mode
The Bullet Mode option controls the overall visual style of the panel. It is found in the Bullet section of the panel editor.
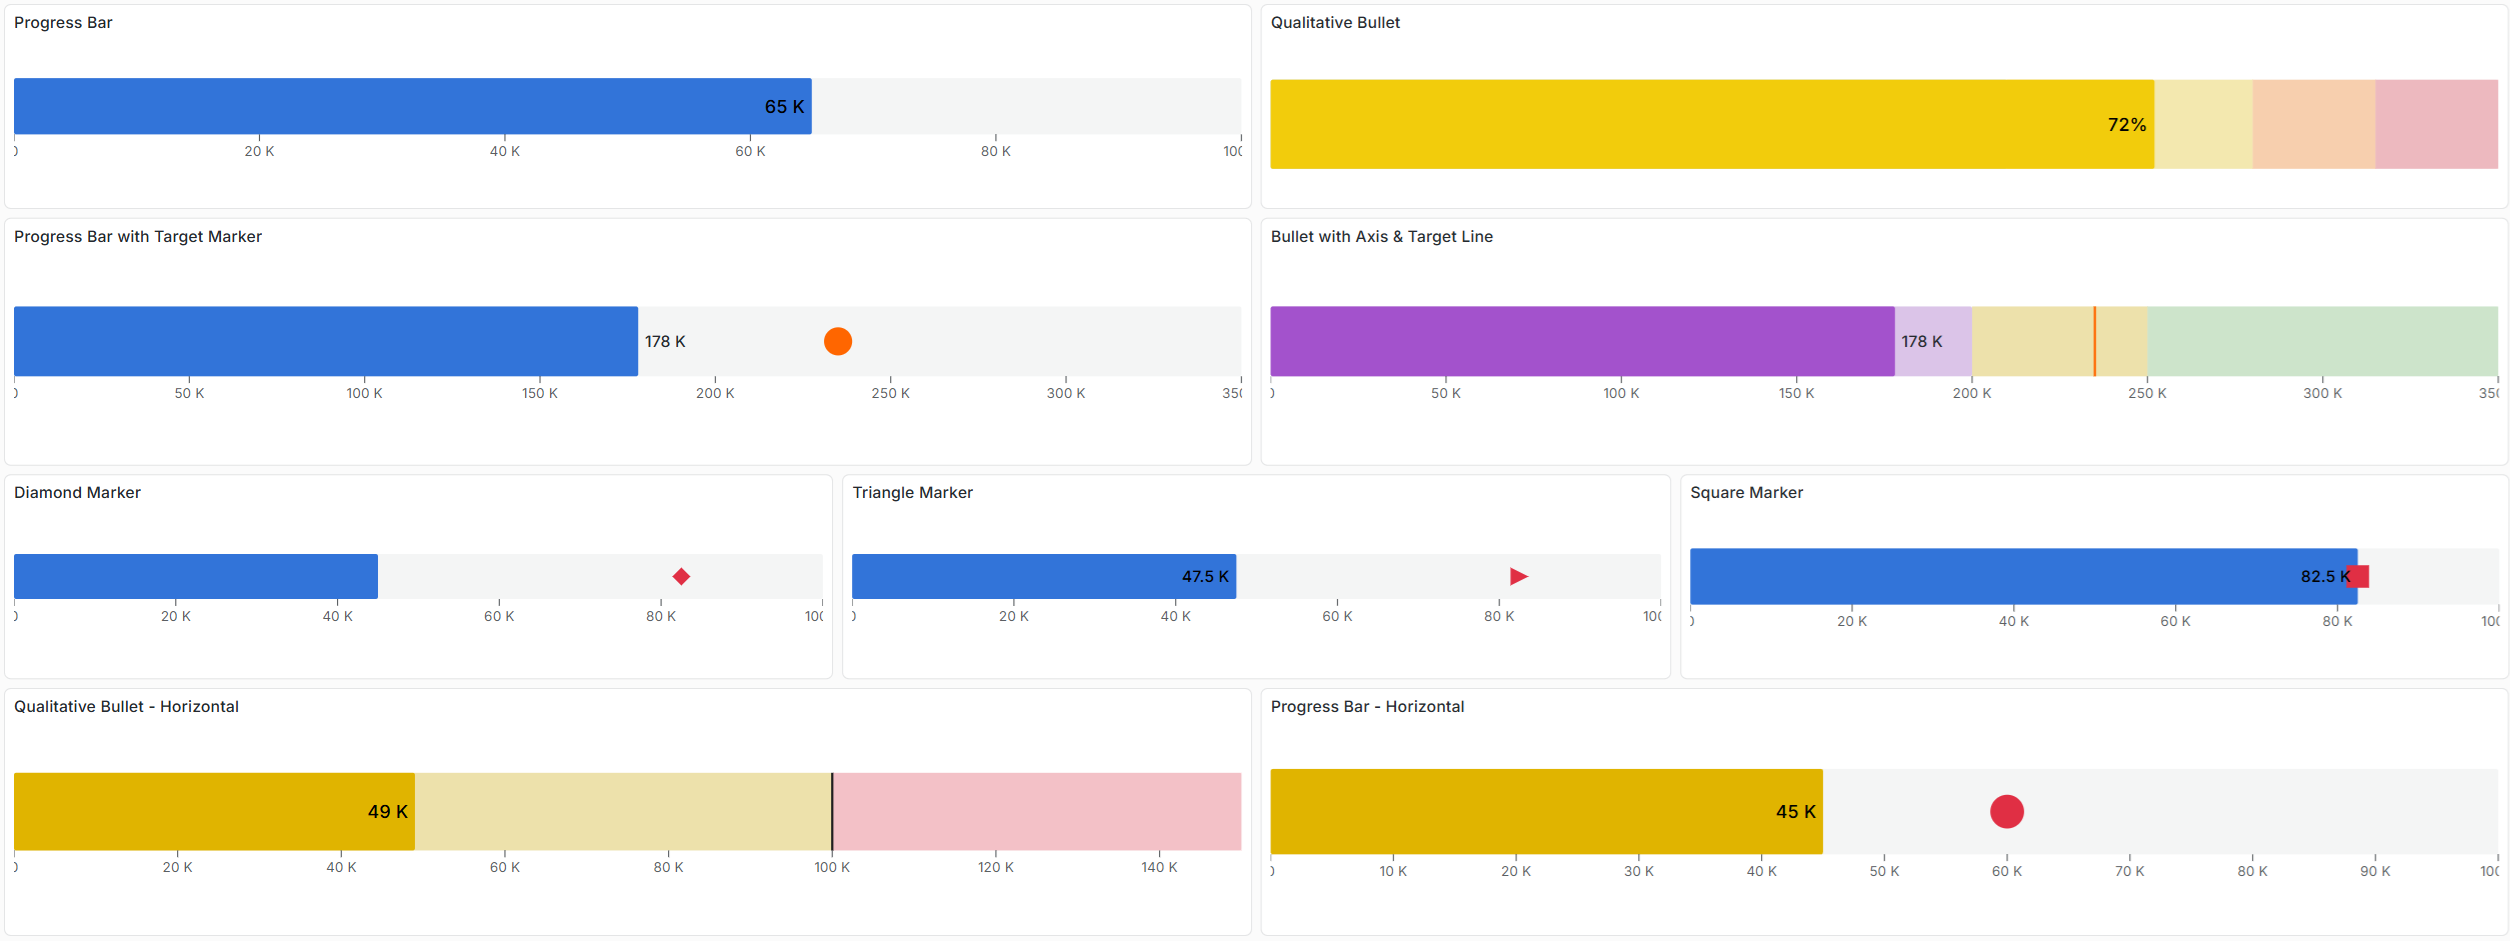
Progress Bar
In Progress Bar mode, the panel renders a simple filled rectangle from the minimum value to the current value. There are no background zones. The fill color is determined by the active threshold (or the default series color if no thresholds are configured).
Use this mode when you need a clean, minimal indicator with no qualitative context — for example, a completion percentage or a utilization gauge.
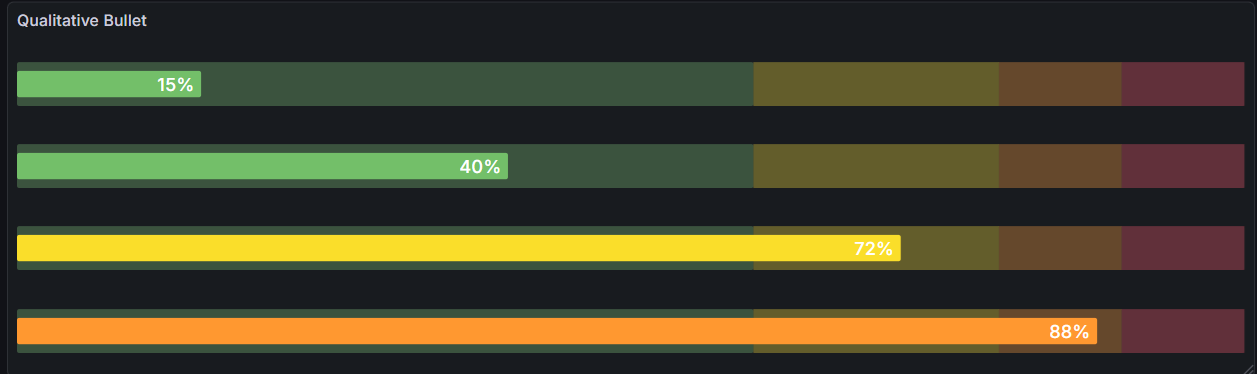
Bullet Chart
In Bullet mode, the panel adds semi-transparent qualitative background zones behind the main bar. Each zone corresponds to a threshold step defined in the field configuration. The zones provide at-a-glance context about where the current value sits within the acceptable performance range.
The background zones are rendered at 30% opacity, keeping the fill color clearly visible in the foreground.

To configure background zones, add thresholds in the field configuration:
- Go to Field > Thresholds in the panel editor.
- Add threshold steps at the boundaries between your qualitative zones.
- Assign colors to each step (e.g., red, yellow, green).
The zone colors and boundaries are taken directly from the threshold configuration, so no additional setup is needed in the Bullet section.
Orientation
The Orientation option controls the direction in which the bar fills.
| Option | Description |
|---|---|
| Horizontal | Bar fills from left to right. Value labels appear inside/right or outside/left. Axis renders below the bar. |
| Vertical | Bar fills from bottom to top. Value labels appear inside/top or outside/bottom. Axis renders to the left. |
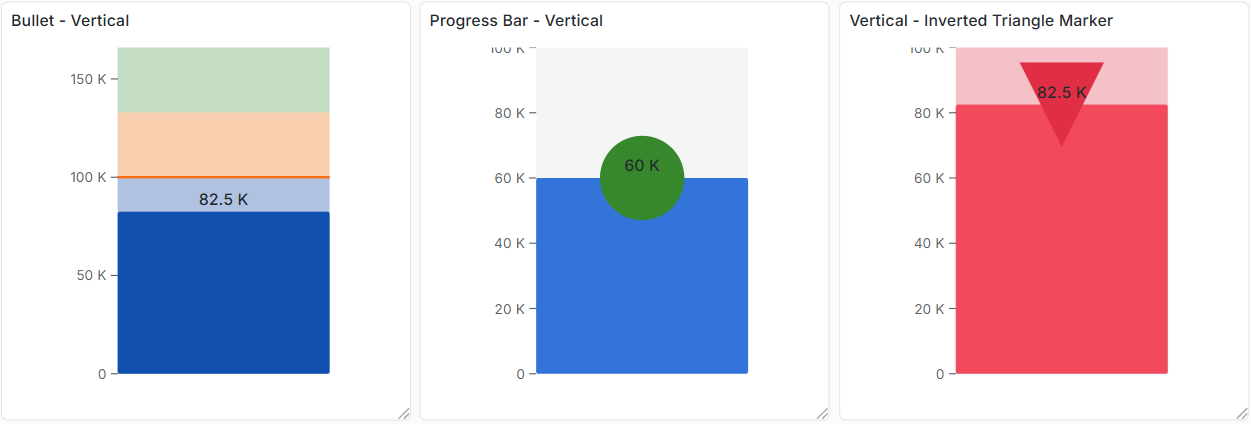
Vertical orientation is useful for column-style dashboards or when displaying several measurements that are conventionally shown as vertical gauges (e.g., tank levels, temperature columns).
Bar Sizing
Two sizing options control the proportions of the bar:
| Option | Description | Default | Range |
|---|---|---|---|
| Bar thickness | Width of the entire bar element (including background zones) as a percentage of the available panel space | 50% | 10–100% |
| Fill thickness | Height of the filled value bar as a percentage of the bar thickness | 100% | 10–100% |
Setting Fill thickness below 100% creates a visual separation between the thin fill bar and the wider background zones — a classic bullet chart style where the main bar is narrower than the qualitative range zones.
Value Label
The value label displays the numeric value (with units and formatting) directly on the bar.
| Option | Description | Default |
|---|---|---|
| Show | Enable or disable the value label | On |
| Placement | Inside — text inside the filled bar, right-aligned; Outside — text outside the fill, left-aligned | Inside |
| Font size | Text size in pixels | 14px |
Text color is handled automatically:
- Inside placement — uses maximum contrast color (white on dark fills, black on light fills) to ensure readability regardless of bar color.
- Outside placement — uses the theme's primary text color.
When SPC mode is active, the value label shows the computed metric (e.g., Cpk: 1.42) rather than the raw last value.
Axis
The optional scale axis displays tick marks and labels along the bar.
| Option | Description | Default |
|---|---|---|
| Show | Enable or disable the axis | Off |
| Tick count | Approximate number of tick marks displayed | 5 |
The axis uses a nice scale algorithm that selects round numbers for tick values. Tick labels are formatted using the field's display processor — units, decimals, and suffixes are respected automatically.
- In horizontal orientation, the axis appears below the bar.
- In vertical orientation, the axis appears to the left of the bar.
Target Marker
The target marker renders a secondary indicator on the bar to show a goal, specification target, or reference value from your data.
Marker Shapes
Six marker shapes are available:
| Shape | Description |
|---|---|
| Line | A full-width line spanning the entire bar thickness (default) |
| Circle | A circular dot |
| Diamond | A rotated square (diamond) shape |
| Triangle | A triangle pointing in the direction of increasing value |
| Inverted Triangle | A triangle pointing opposite to the value direction |
| Square | A square shape |
Marker Appearance
| Option | Description | Default |
|---|---|---|
| Field name | The data field to use as the marker value | (none) |
| Marker shape | Shape of the marker symbol | Line |
| Marker size | Size as a percentage of bar thickness (10–100%) | 40% |
| Marker color | Color of the marker | semi-dark-orange |
To add a target marker:
- Configure a query that returns both a main value field and a target/goal field.
- Go to Target marker in the panel editor.
- Set Field name to the field that holds the target value.
When the target field is selected, it is separated from the main bar display. The bar shows the primary metric; the target marker shows the secondary field.
If your data source returns the target as a constant or configuration value, you can use a separate query (e.g., a SQL query returning a single row) alongside your time series query. Use Feature Queries or field overrides to hide the reference query from the display while still making its value available to the target marker.
SPC Mode (Optional)
SPC (Statistical Process Control) mode is entirely optional. By default, the panel displays the last value from the selected field — behaving like a standard progress bar or gauge.
When you select an SPC metric, the panel computes a statistical summary from the entire time series in the panel's time range and displays that computed value on the bar instead of the raw last reading.
This allows you to build dashboards that show process performance metrics (Cpk, mean, standard deviation) directly, without needing a separate transformation or calculation node in your query.

SPC Metrics
| Metric | Description | Spec Limits Required |
|---|---|---|
| None | Display the last non-null value (default) | No |
| Mean | Average of all values in the series | No |
| Std Dev (σ) | Sample standard deviation of all values | No |
| Cpk | Short-term process capability index | Yes (LSL and/or USL) |
| Cp | Short-term process capability (spread only, not centering) | Yes (LSL and USL) |
| Ppk | Long-term process performance index | Yes (LSL and/or USL) |
| Pp | Long-term process performance (spread only) | Yes (LSL and USL) |
| Sigma Level | Distance from the process mean to the nearest spec limit, in standard deviations | Yes (LSL and/or USL) |
Specification Limits
LSL (Lower Specification Limit) and USL (Upper Specification Limit) define the acceptable range for your process. They are required for capability-based metrics (Cpk, Cp, Ppk, Pp, Sigma Level).
| Option | Description | Default |
|---|---|---|
| LSL | Lower Specification Limit | 0 |
| USL | Upper Specification Limit | 100 |
LSL and USL options are only shown when the selected metric requires them. USL must be greater than LSL for calculations to produce valid results.
LSL and USL are not the same as the panel's Min and Max field configuration values.
- Min/Max control the visual scale of the bar.
- LSL/USL are the process specification boundaries used for SPC calculations.
Cpk vs Ppk
The SPC Bullet computes both short-term (Cp, Cpk) and long-term (Pp, Ppk) capability indices. The difference lies in how process variation is estimated:
| Index | Sigma Estimation | Description |
|---|---|---|
| Cp / Cpk | Within-subgroup (moving range method) | Short-term capability — measures potential process performance |
| Pp / Ppk | Overall (sample standard deviation) | Long-term performance — measures actual process performance over time |
The "k" suffix (Cpk, Ppk) accounts for process centering — it penalizes a process that is within spec but shifted away from the center. Cp and Pp measure only the spread relative to the specification width without regard to centering.
Minimum data requirement: All SPC metrics require at least 2 finite data points. With fewer points, the bar displays no value.
Threshold-Based Coloring
The fill color of the bar is determined by Grafana's standard threshold system. The threshold is evaluated against the displayed value — which is either the raw last value or the computed SPC metric, depending on the selected mode.
This means you can set up threshold-based alerts visually:
- Set a threshold at Cpk = 1.33 with color green → bar turns green when the process is capable
- Set a threshold at Cpk = 1.0 with color yellow → bar turns yellow when marginally capable
- Base color red → bar is red when Cpk < 1.0
Configure thresholds in Field > Thresholds in the panel editor, just as you would for any other Grafana visualization.
Multi-Series Layout
The panel uses Grafana's VizRepeater to render one bullet per data series. When your query returns multiple fields or series, each gets its own bar automatically.
- Bars are stacked in the panel space — vertically for horizontal orientation, horizontally for vertical orientation.
- Item spacing between bars is 8px.
- Each bullet independently resolves its fill color from its own threshold evaluation.
- The target marker is matched per-series: if a target field is configured, each bullet shows the target marker at the appropriate position for that series.
Configuration Reference
Panel Options
| Section | Option | Description | Default |
|---|---|---|---|
| Bullet | Bullet mode | Progress bar or Bullet | Bullet |
| Bullet | Orientation | Horizontal or Vertical | Horizontal |
| Bullet | Bar thickness | Bar width as % of available space | 50% |
| Bullet | Fill thickness | Fill bar height as % of bar thickness | 100% |
| Value label | Show | Display the value label | On |
| Value label | Placement | Inside or Outside the fill bar | Inside |
| Value label | Font size | Text size (8–48px) | 14px |
| Axis | Show | Display the scale axis | Off |
| Axis | Tick count | Number of axis tick marks (2–20) | 5 |
| Target marker | Field name | Data field to use as the target position | (none) |
| Target marker | Marker shape | Line, Circle, Diamond, Triangle, Inverted Triangle, Square | Line |
| Target marker | Marker size | Marker size as % of bar thickness (10–100%) | 40% |
| Target marker | Marker color | Marker color | semi-dark-orange |
| SPC | Metric | SPC metric to display (None, Mean, Std Dev, Cpk, Cp, Ppk, Pp, Sigma Level) | None |
| SPC | LSL | Lower specification limit | 0 |
| SPC | USL | Upper specification limit | 100 |
Field Configuration
| Option | Description | Default |
|---|---|---|
| Min | Minimum value for the bar scale | 0 |
| Max | Maximum value for the bar scale | 100 |
| Thresholds | Threshold steps for fill color and background zones | (none) |
| Unit | Display unit for the value label and axis | (none) |
| Decimals | Number of decimal places for value display | Auto |
Part of the KensoBI SPC Suite
SPC Bullet is part of a growing family of Statistical Process Control plugins for Grafana by Kenso Software:
SPC Characteristic Datasource — The datasource that powers the SPC CAD panel. Connects to your measurement database (PostgreSQL or MSSQL), lets you select features and characteristics through a point-and-click interface, and returns SPC statistics, time series measurements, and forecast data — no SQL required.
SPC CAD Panel — Brings 3D geometry into the picture, letting you bind the data from control charts and histograms to physical features on your parts.
SPC Chart Panel — Control charts for monitoring process stability over time. Supports XmR, Xbar-R, and Xbar-S charts with automatic calculation of LCL, UCL, and Mean control limits.
SPC Histogram Panel — Distribution analysis with histograms, bell curves, and a built-in statistics table showing Cp, Cpk, Pp, and Ppk. Use it to understand process capability: is your process producing results within specification limits?
SPC Box Plot Panel — Box-and-whisker plots with built-in SPC. Automatically groups measurements into subgroups, computes quartiles and outliers, and overlays Xf-Rf control limits to detect shifts in both process location and spread.
SPC Pareto Panel — Identify the most significant factors contributing to defects, downtime, or any categorical issue — so you can focus improvement efforts where they matter most.
Getting Help
- Contact support at https://kensobi.com/contact
- Join the KensoBI Discord for questions and discussion.
License
This software is distributed under the Kenso Software Commercial License. Use requires a valid commercial license.