SPC Panel
Welcome to the KensoBI SPC panel for Grafana. This plugin allows you to build common statistical process control (SPC) charts like Xbar-R and Xbar-S charts using time-series data in Grafana.
Plugin Overview
Available options
-
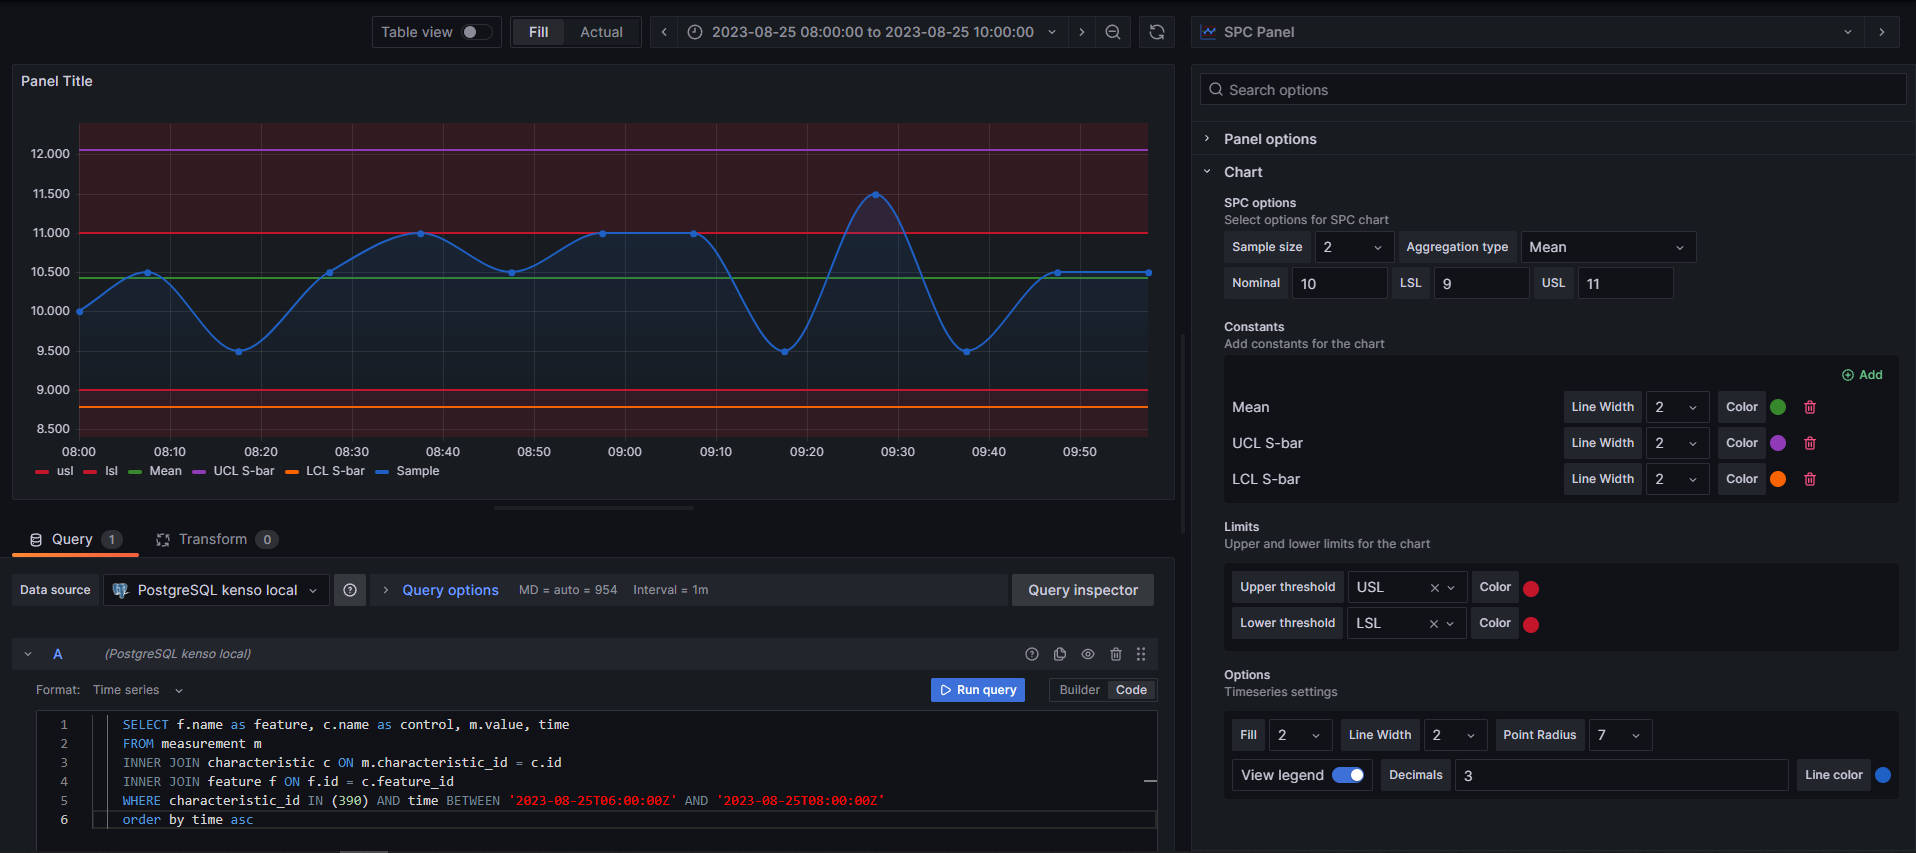
Constants: The constants for your data visualization, such as minimum, nominal and maximum values. Data for constanst can be downloaded from a datasource or entered using an editor.
-
Limits: The limits for your data visualization, such as Upper Specification Limit (USL), Lower Specification Limit (LSL) values. Data for Limits can be downloaded from a datasource or entered using an editor.
-
Fill: Customize the area or space under your graph lines.
-
Line width: Adjust the width of the lines in your graph to make your data more visible and distinctive.
-
Piont radius: Control the size of data points in your graph, making them more or less prominent as needed.
-
View legend: Toggle the display of a legend to help your audience understand the data in your visualization.
-
Decimals: Set the number of decimal places to display in your data labels, providing more or less precision.
-
Line color: Customize the color of your graph lines to match your desired visual style.
Variables
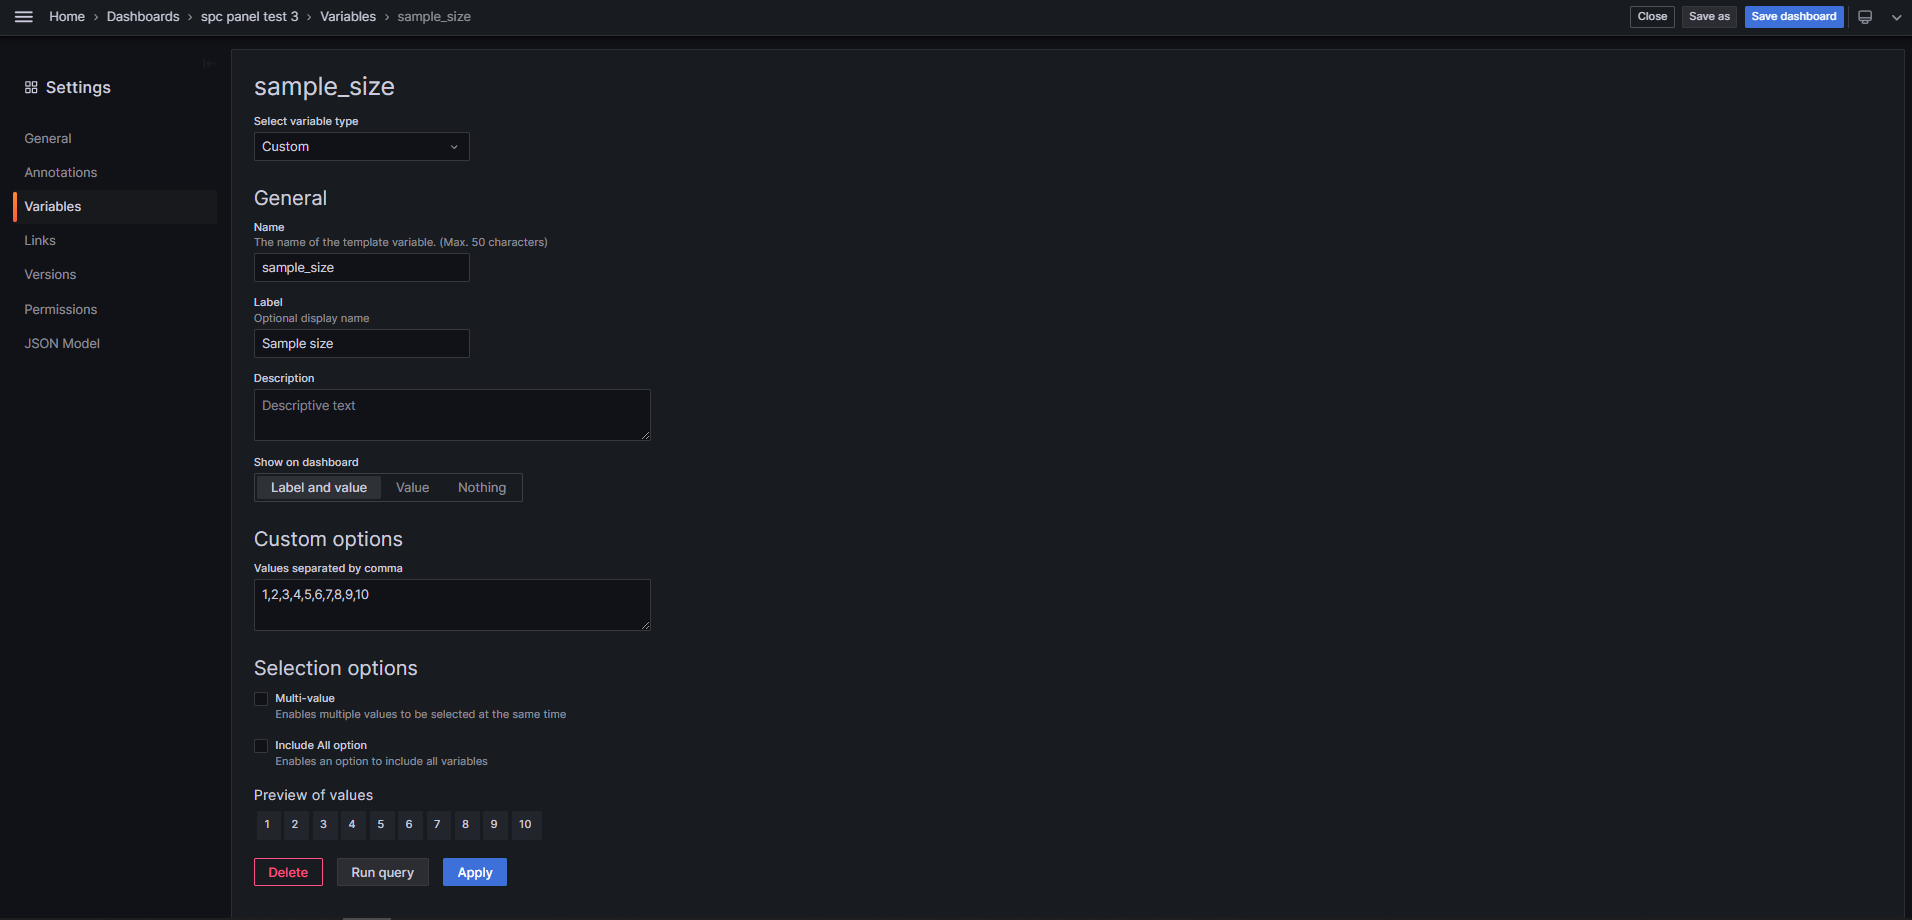
SPC Panel is adapted to work with variables. Sample size is available as a variable in dashboard settings.
After clicking on dashboard settings and going to the Variables tab, you can create a new variable whose name should be sample_size. Label can be anything. The definition should contain 1, 2, 3, 4, 5, 6, 7, 8, 9, 10 to make everything work with the calculations.
Example of added variable sample_size below:
How to built SQL query
Building a chart using PostgreSQL datasource
To create a chart, you must run an SQL query. In PostgreSQL datasource, you need to select the Time series data format and then write the SQL query. The data should include value and time. The time should be saved in the database as timestamp.
SQL query example:
SELECT value, time
FROM measurement m
INNER JOIN characteristic c ON m.characteristic_id = c.id
WHERE characteristic_id IN (151)
order by time asc
Custom constants values in the chart
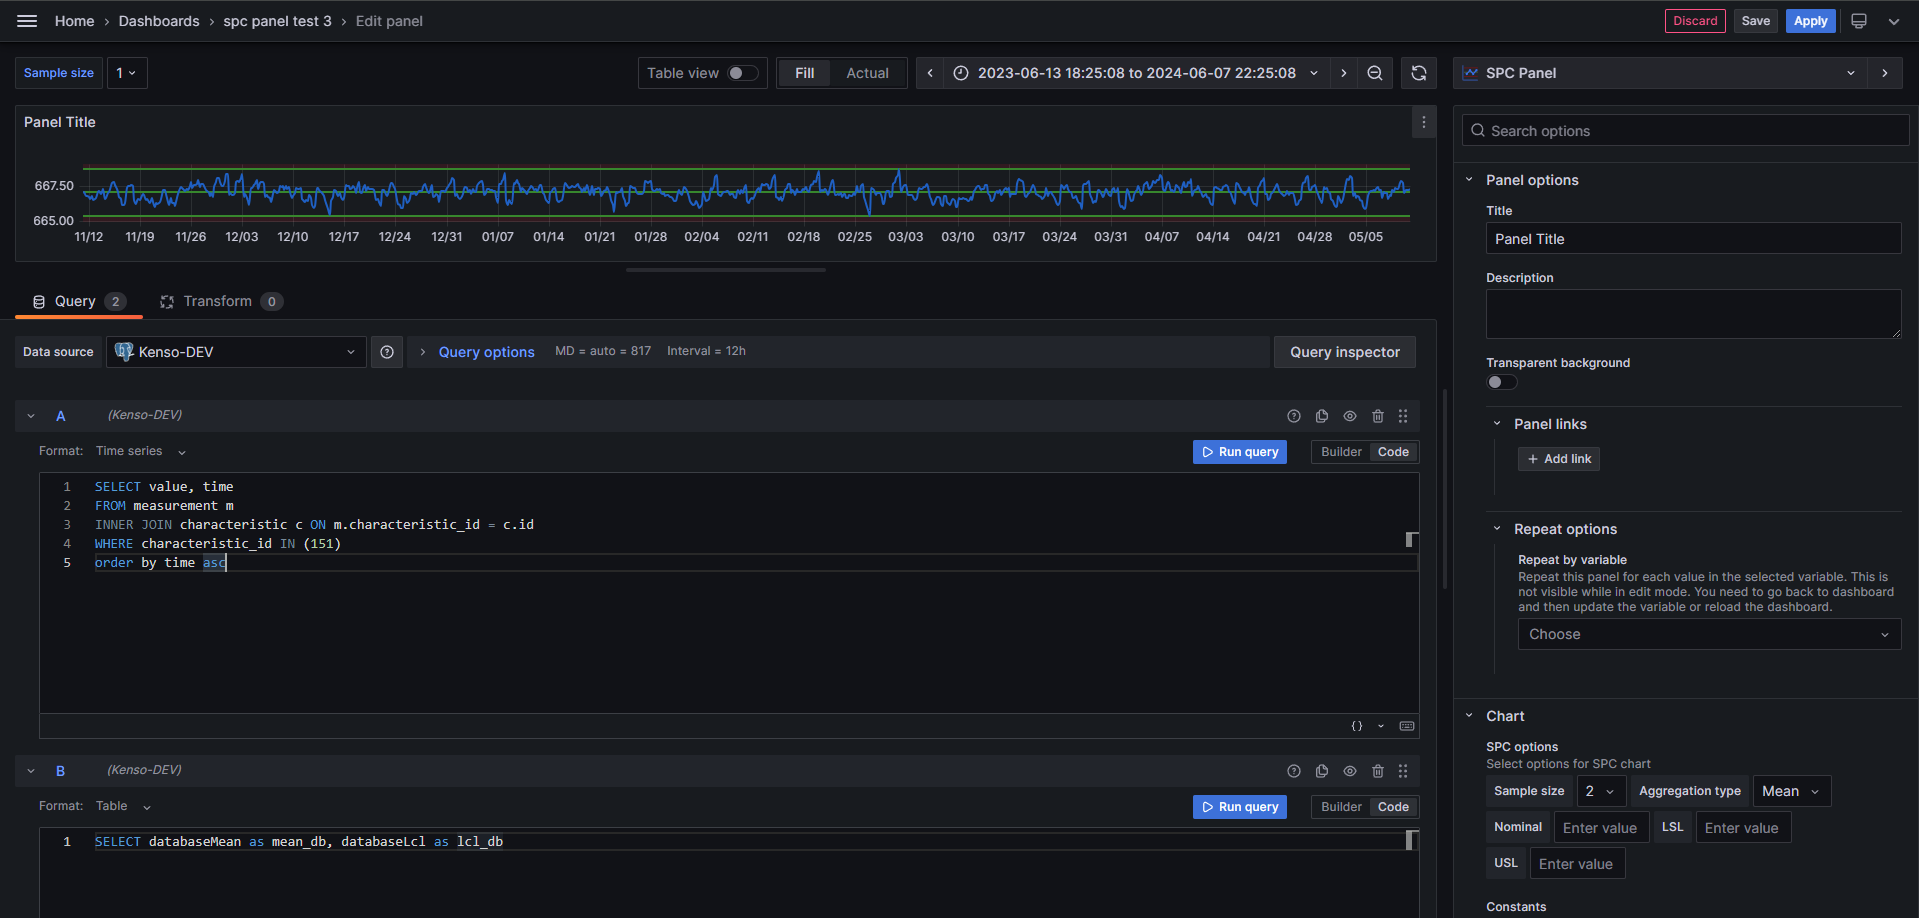
SPC Panel, in addition to standard calculations, allows you to add additional constants values on the chart. These values can be selected from the database using a simple SQL query in Table format. For everything to work properly, the PostgreeSQL datasource should contain 2 separate queries, the chart should be in Time series format, and constants should be in Table format.
The following names are reserved for calculations in the panel and should be avoided when writing SQL queries: nominal, lsl, usl, min, max, mean, range, lcl_Rbar, ucl_Rbar, lcl_Sbar, ucl_Sbar, lcl, ucl.
SQL query example:
SELECT databaseMean as mean_db, databaseLcl as lcl_db
How to build X-bar R chart
X-bar for R chart
R Chart
How to build X-bar S chart
X-bar for S chart

S chart
Data Source Compatibility
This plugin is designed to work seamlessly with all available data sources in Grafana. Whether you are using InfluxDB, Prometheus, Elasticsearch, or any other supported data source, you can utilize the full potential of this plugin to enhance your data visualization.
Feel free to modify and customize these settings to suit your specific needs and preferences.
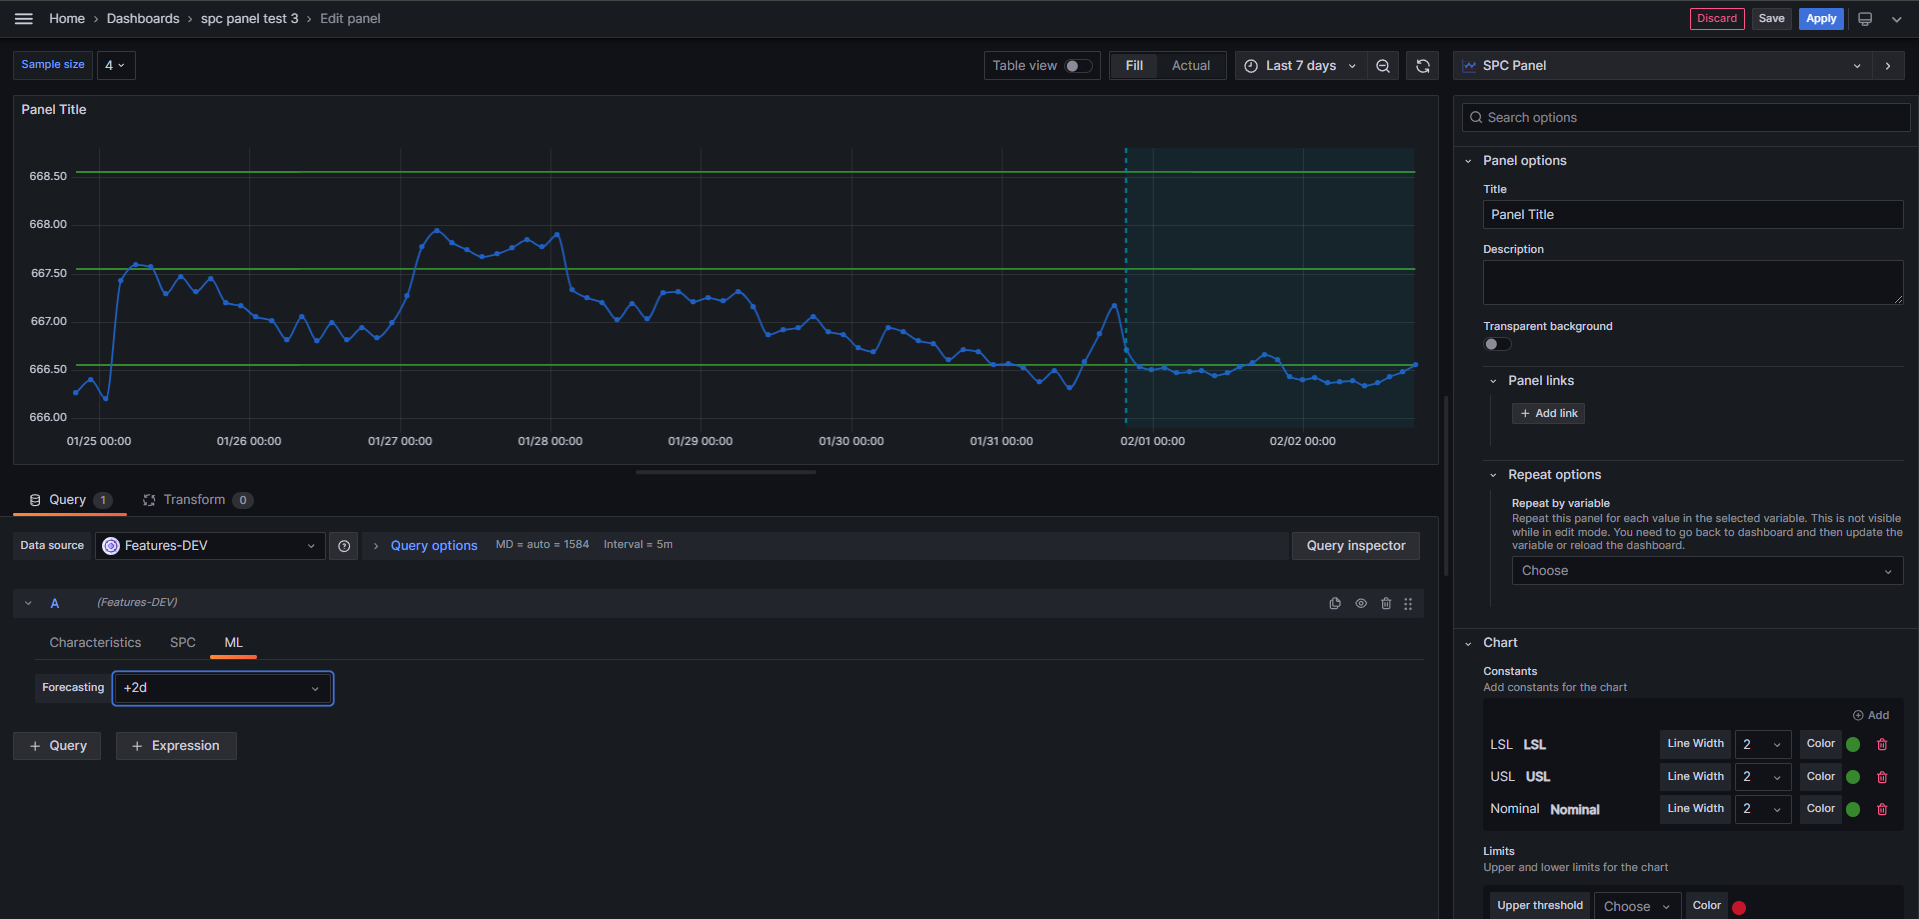
Forecasting support
SPC Panel supports forecasting. It allows for trend forecasting in cooperation with feature datasource. Forecasts of trend changes can be observed and the process can be improved. More information in the forecasting section of feature datasource.
Functions documentation
The SPC Panel plug-in uses various functions to analyze data and calculate constants. For detailed information about these mathematical formulas, please refer to the section Functions Documentation.