Configuration
Below, we'll show you how to set up the basic configuration and display your data in the 3D panel.
The following things are required in order to follow this tutorial.
Pre Requirements:
- KensoBI system installation
- A
Postgresdatabase with either theQDASschema or theKensoschema. - Ensure that your database contains either production or mock data.
Notice that during your first sign-in attempt, you will be asked to change the default password. (l:
admin, p:admin)
Add Datasoucres
First of all, KensoBI needs to have access to your data. It's divided to two datasoucre types:
- A database connector for DB communication
- The
feature-datasourcewhich handles allSQLauto generation and data transformation for you under the hood.
The graph above shows the journey your data makes from your database to a graphical display.
Such an approach - using a Grafana built-in DB connectors - gives us several benefits:
- The feature-datasource is almost independent of the database engine;
- We don't have to develop our own connectors and instead use a well-tested ones.
That button should take you to a list of all the available plugins.
Since the KensoBI system is based on Grafana, there are numerous plugins you can use. The complete list is here: Grafana list of datasources.
Find the PostgreSQL plugin in the list, which we'll use as a DB connector. Then click on it to add a new datasource based on this plugin.
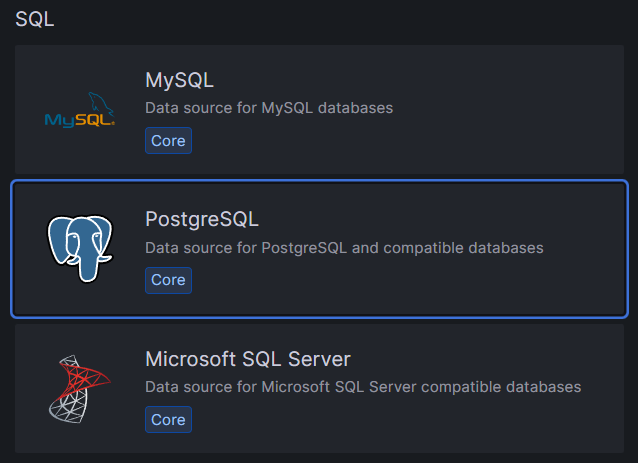
In the new plugin creator view, give it a name and enter all the necessary information to connect to your PostgreSQL database.
Don't worry entering a password - other users and even you, will not be able to see it after it is sent to the backend. Instead, you will see the phrase configured.
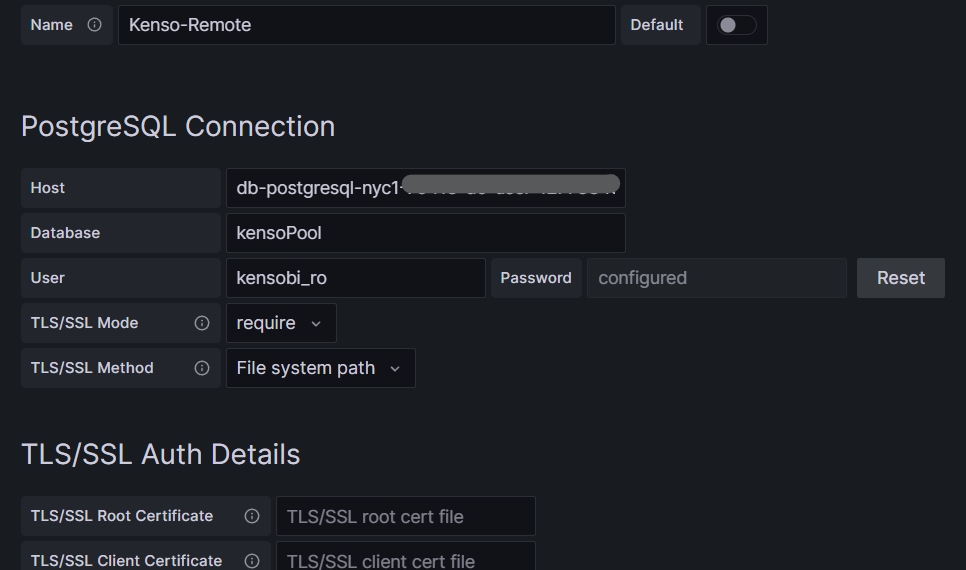
Above, there's a screenshot of an example plugin configuration.
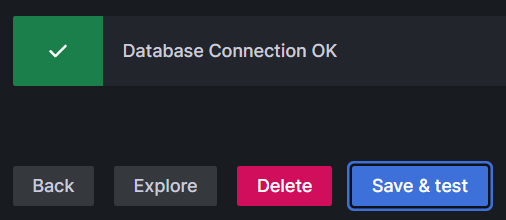
To save new plugin, click on Save & test.
Make sure your database is running and there is network connection between this system and your DB. If so, the success alert with a text Database Connection OK should pop up.
Otherwise, review connection details and try again.
If you have successfully added a database plugin, you have completed half of the data source configuration process.
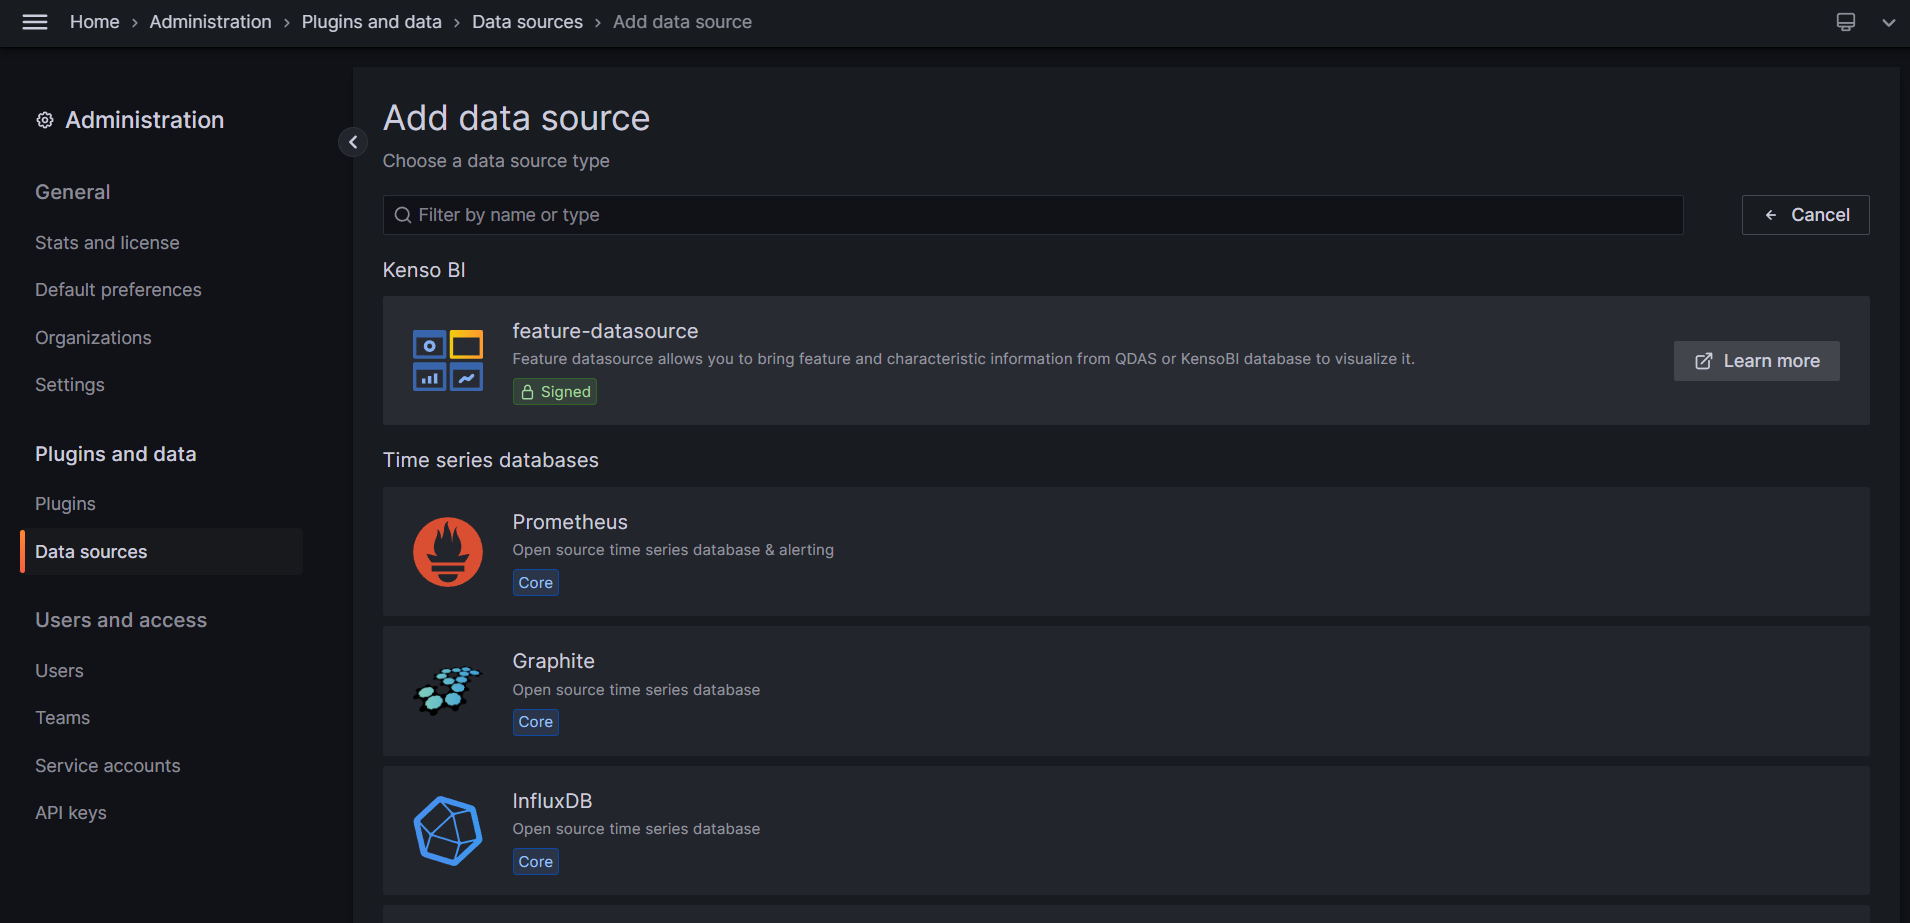
Add a Feature Datasource
The next step is to add KensoBI datasource plugin, which is called feature-datasource. You can find it in the plugin list within the Add data source view.
In the configuration form of the selected plugin, select Database plugin from the list. Your previously configured one should appear there.
After that, you can choose a schema you use in your DB.
Note that depending on the schema you select, different additional fields may appear for configuration.
For now, you can skip the ML parameters. These parameters are used to configure a additional service connection with Machine Learning algorithms that can be applied to your data, but they are not necessary for setting up basic data sources.
Once you have finished configuring the plugin, click on Save & test button.
If everything was set up correctly, you should see a success message. If you do not see the success message, double-check your database plugin and confirm that your DB has the proper schema initialized.
At this stage, you should have two datasource plugins. Which will allow you to begin creating your first dashboard.
Create a dashboard
Dashboards are the main concept of our KensoBi system. They consist of panels that are ordered in a grid system, which you can adjust to suit your needs. Each panel gets data from one (or more) datasources and displays a view according to the selected panel plugin.
The most common built-in visualisation type in Grafana is Time series
KensoBI develops its own visualisation type called CAD panel. Below we'll show how to use it.
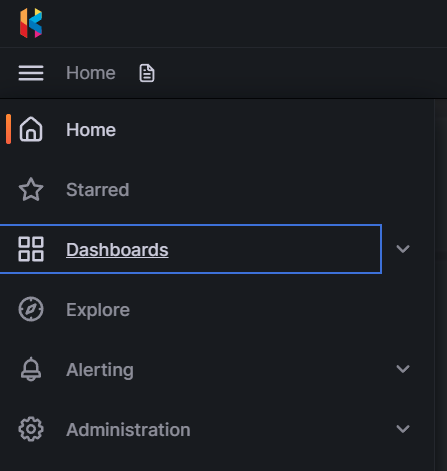
To get started, we need to create a new dashboard. Go to the menu and click on the Dashboards category button.
On the top-right corner of the Dashboards page, locate the New button and click on it. Then select New Dashboard from the drop-down menu.
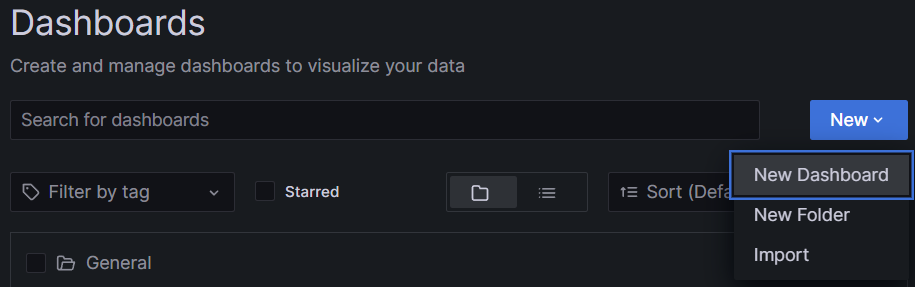
As you can see in the screenshot above, you can also create folders for dashboards and import them. Furthermore, there is a tag and a search system included to help you manage your dashboards. If you want to learn more about how to manage dashboards, check out the Grafana dashboards documentation.
Create a Panel
As you may recall from earlier in this chapter, a panel is a container for a specific type of visualization within a dashboard.
To create a panel, click on Add a new panel in your new dashboard view.
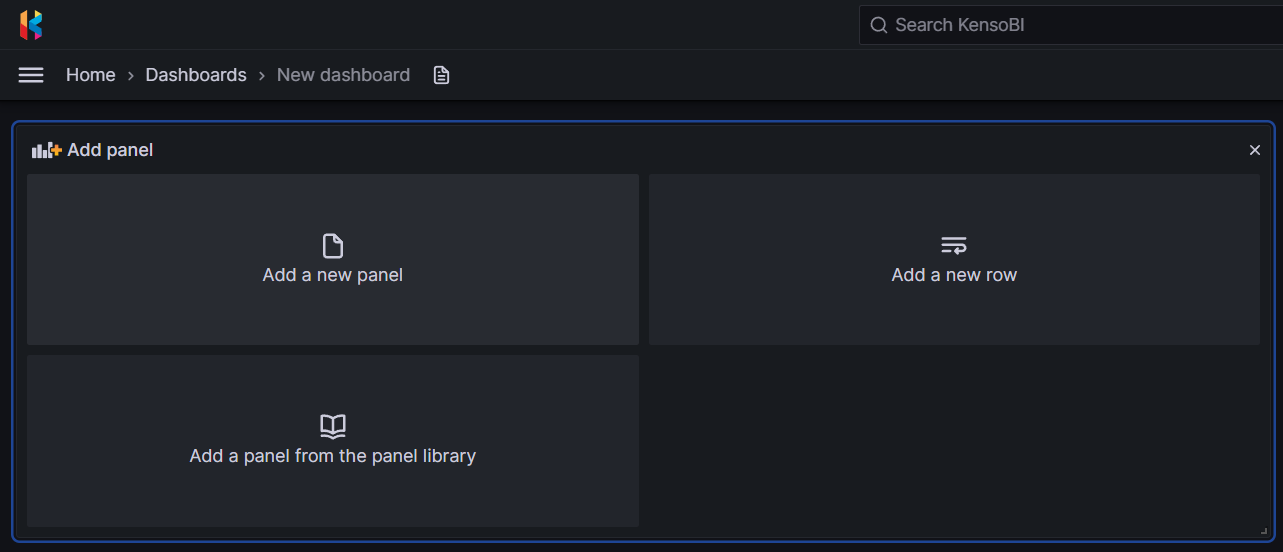
After clicking on Add a new panel, the system will take you to the panel edit page where you can customize the panel's visualization and data source settings. From here, you can choose which data sources to use, set up visualization options, and adjust the layout of the panel to fit your needs.
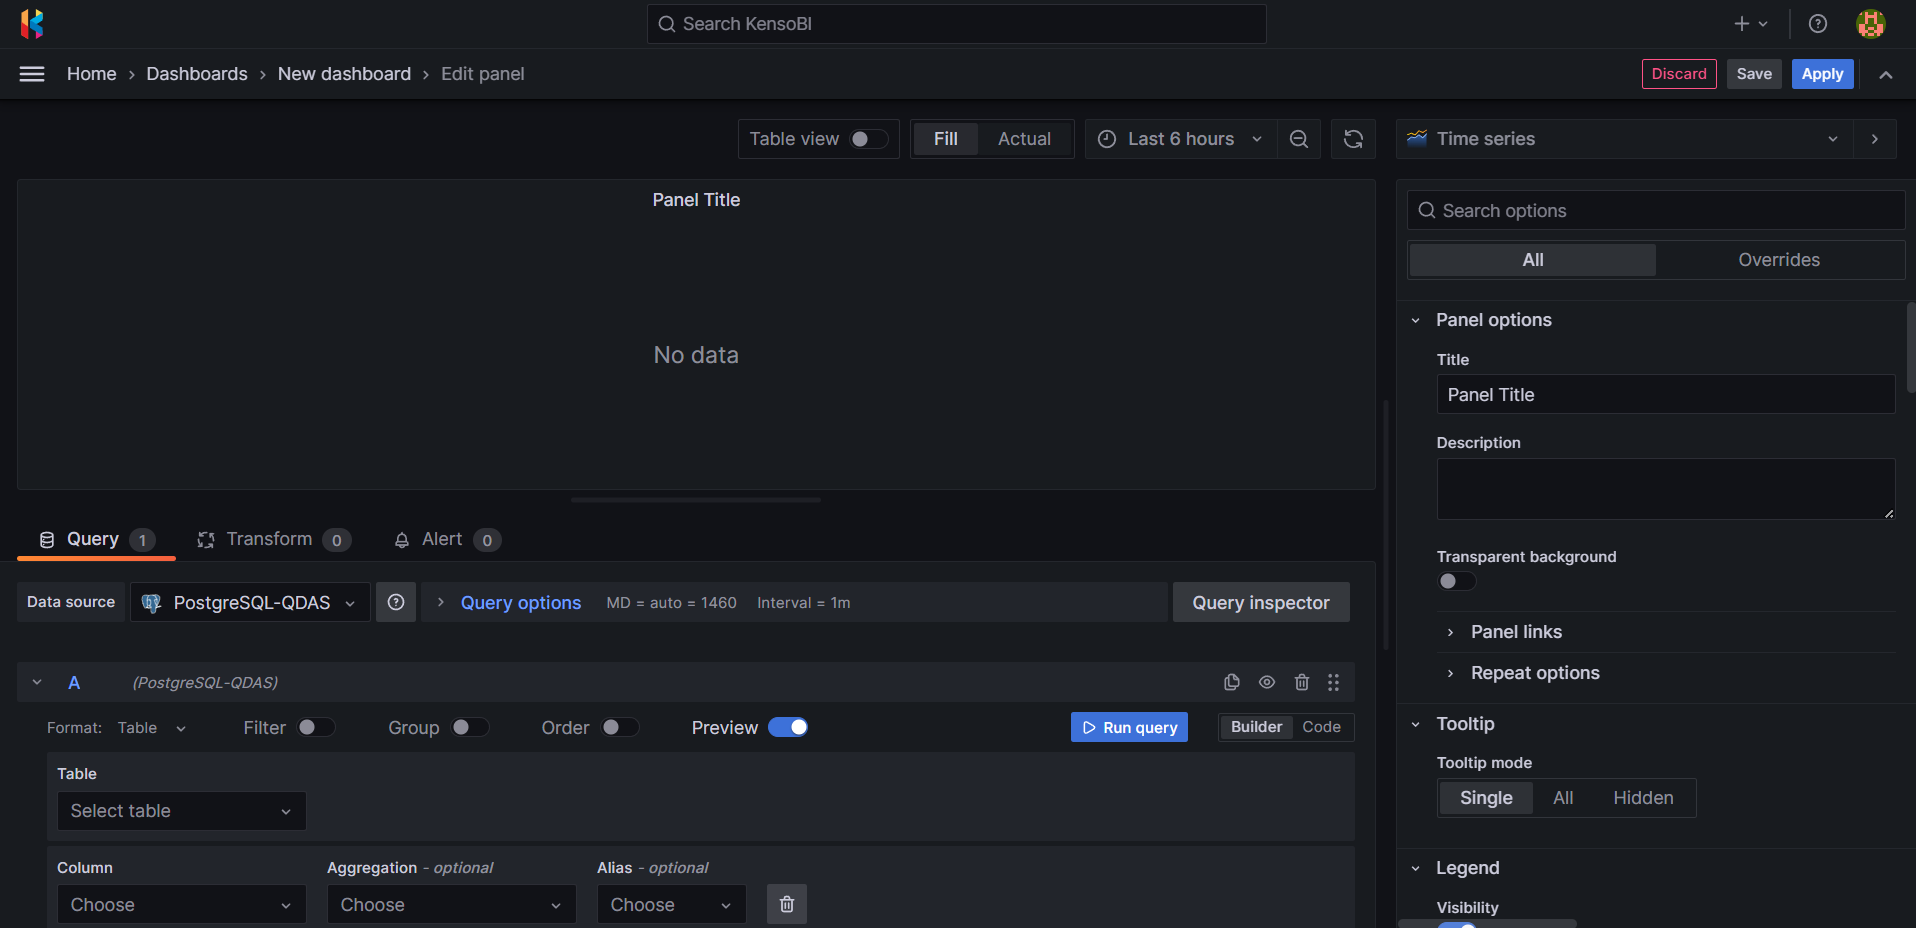
The panel edit page is divided into several areas.
- At the bottom, you can configure the data sources for the panel.
- On the right-hand side, there is a select box where you can choose the visualization type you want to use and customize its settings.
- In the center of the page, there is a preview of your panel visualization that updates in real-time as you make changes.
- Finally, in the top-right corner, you can find a Save button to save your panel and return to the dashboard view.
Keep in mind that the time-based data you fetch from datasources are limited to the selected time window. The time window is an additional filter for your data that is selected by the user at the top of the panel and dashboard view. This means that you can customize the time window to display data for a specific time period, such as the
past hour,day, orweek, depending on your needs. By adjusting the time window, you can fine-tune your data and create more accurate visualizations.
Feature Datasource configuration
Typically, the first step in creating a new panel is to configure the data source(s) that it will use.
In this tutorial we'll be using only one datasource - KensoBI developed feature-datasource.
As shown in the animation below, click on the Data source selector and choose the feature-datasource plugin instance that you created earlier in this tutorial and gave a specific name to during the datasource configuration process.
After selecting the feature-datasource plugin instance, you will see the plugin's user interface, which is divided into several tabs:
- Features - This is the main view where you can find and select the features that you want to display on your panel.
- Characteristics - When you select features in the first tab, their characteristics will appear here. You can select and deselect characteristics depending on your needs to fine-tune your data display.
- SPC (Statistical Process Control) - This tab allows you to select which calculations you want the datasource to perform on the fetched data to help you with statistical analysis.
- ML (Machine Learning) - This tab provides additional configuration options for a prediction system using machine learning algorithms. These options are not necessary for basic data visualization and can be skipped for now.
The CAD panel visualisation requires three characteristics -
x,yandz- to display a feature in 3D space. Therefore, when you select a feature, these characteristics are automatically selected for you to simplify the process of setting up the panel.
Since the CAD panel visualization requires data to display, we have already selected some features for the purposes of this tutorial, as shown in the screenshot above. Now, let's do the same thing with your data so that you can see the visualization in action.
Optionally you can also select a few calculations in the SPC tab.
Visualization using CAD-Panel
One of the main components of KensoBI is the CAD panel visualization plugin.
However, when you create a new panel, the default visualization type is Time series. If you see this type of visualization, your data display may look similar to the screenshot below.
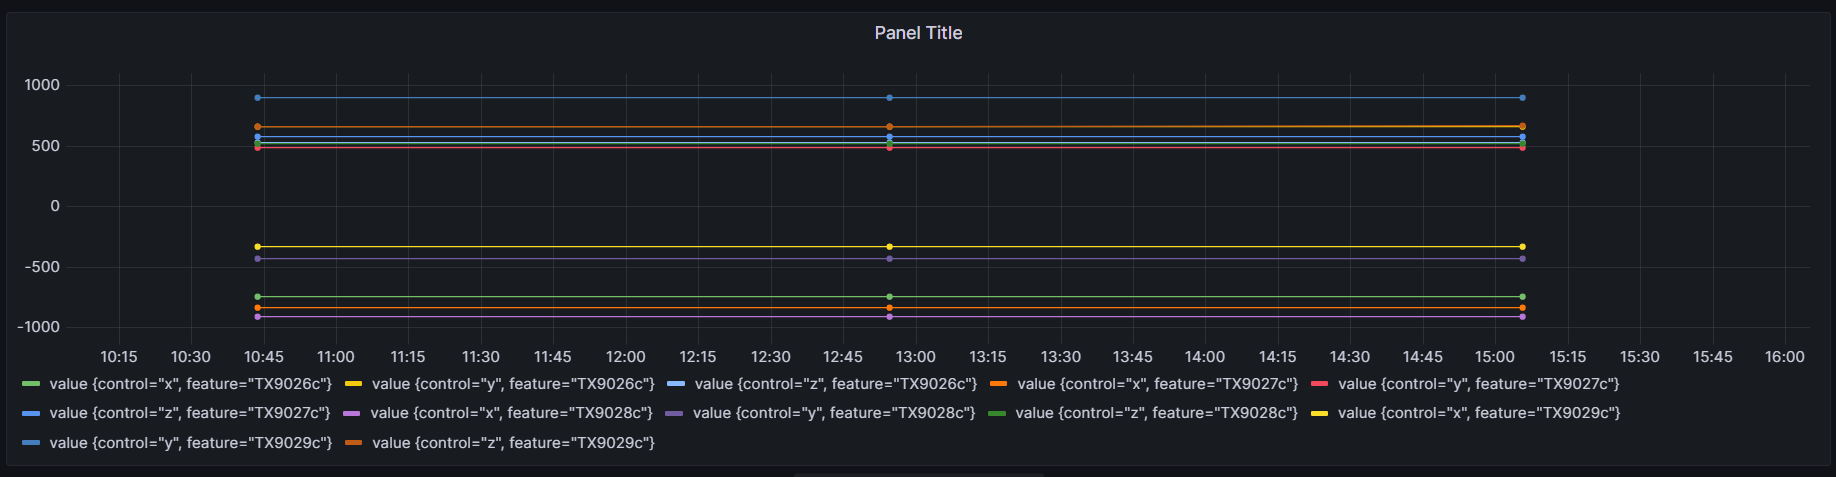
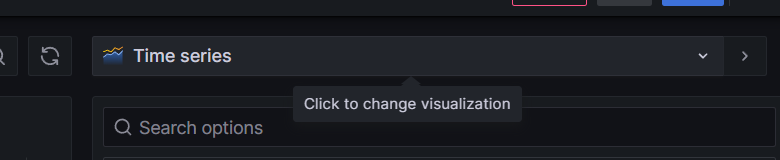
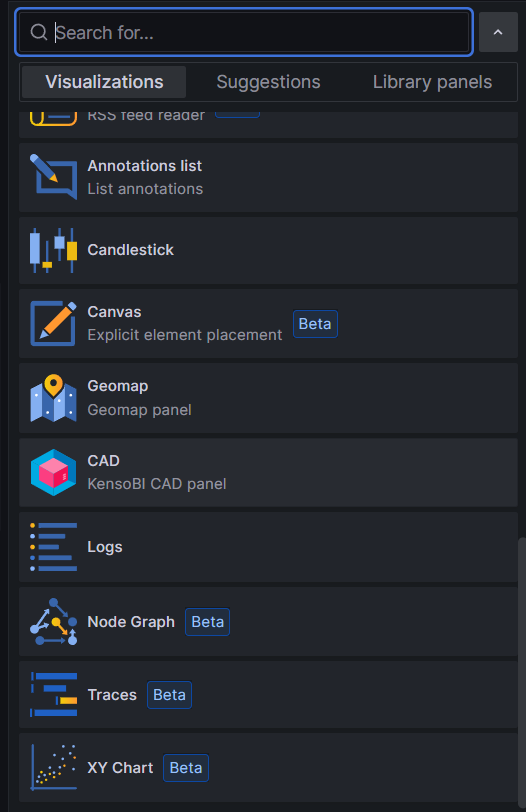
To change the visualization type, look for the dropdown menu in the top-right corner of the panel editor and select the type of visualization you want.
In our case, select CAD panel.
After selecting the CAD panel visualization type, you will see a 3D visualization of your data.
If you can't see the points of the selected features, try rotating, panning, and zooming the 3D view using the following controls:
- Rotate: Left mouse buton
- Pan: Right mouse button
- Zoom: Mouse wheel
You can click on a point to show a label with color and name of selected feature. To close that label, click on the point once again. When you click on the label, the feature window will appear. This window contains all available information about the feature and can be positioned by dragging and dropping it within the grid system.
Below is an example of what your view may look like at this stage of the tutorial.
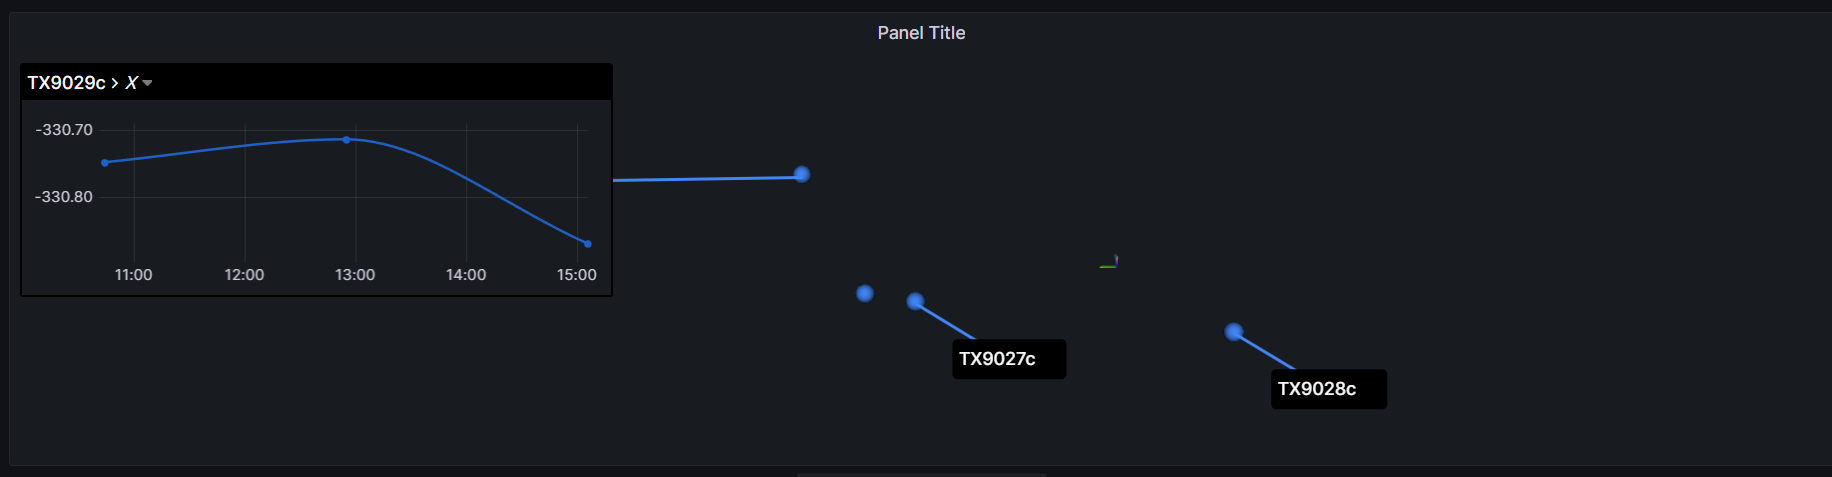
Please note that the process of adjusting feature windows and the 3D view is described in more detail in the documentation. However, feel free to test it out during this tutorial to become more familiar with all the features.
To save your work on the new panel, click on the Save button as shown below.
So, that's the basics covered. Let's recap!
In this tutorial, you learned how to configure data sources and create a dashboard with the KensoBI system. We covered how to add a new data source using the PostgreSQL plugin, configure the feature-datasource plugin, and create a new panel with the CAD panel visualization. We also provided tips for adjusting the 3D view and feature windows. By following these steps, you should now be able to create your own dashboards and visualize data with the KensoBI system.